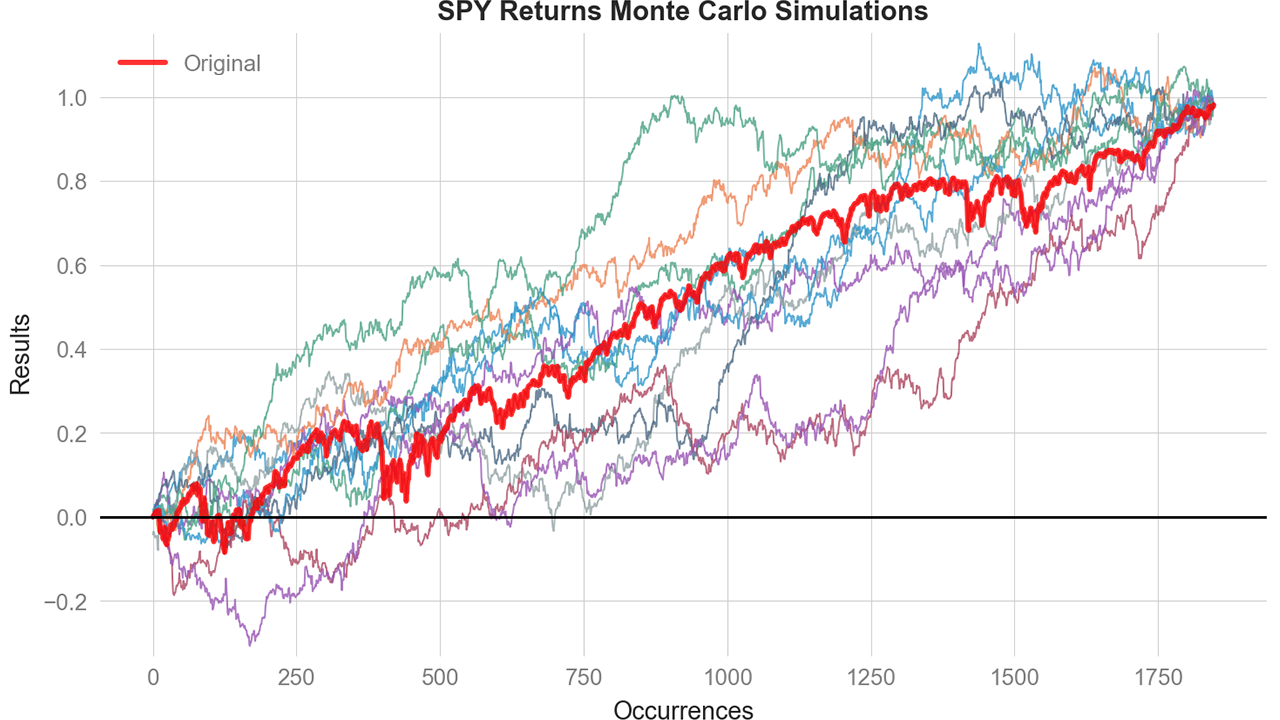
QuantStats includes built-in Monte Carlo simulation capabilities for probabilistic risk analysis. Run thousands of simulations by shuffling historical returns to understand the range of possible outcomes for your strategy.
import quantstats as qs

# fetch daily returns
returns = qs.utils.download_returns('SPY')

# run Monte Carlo simulation with 1000 paths
mc = qs.stats.montecarlo(returns, sims=1000, seed=42)

# view terminal value statistics
print(mc.stats)
Output:
{
    'min': -0.15,
    'max': 0.85,
    'mean': 0.32,
    'median': 0.31,
    'std': 0.18,
    'percentile_5': 0.05,
    'percentile_95': 0.62
}Calculate the probability of hitting a drawdown threshold (bust) or reaching a return goal:
# Set bust threshold at -20% drawdown, goal at +50% return
mc = qs.stats.montecarlo(returns, sims=1000, bust=-0.20, goal=0.50, seed=42)

print(f"Probability of bust: {mc.bust_probability:.1%}")
print(f"Probability of reaching goal: {mc.goal_probability:.1%}")
Output:
Probability of bust: 23.4%
Probability of reaching goal: 67.8%
Analyze the distribution of maximum drawdowns across all simulations:
print(mc.maxdd)Output:
{
    'min': -0.45,      # worst drawdown across all sims
    'max': -0.05,      # best (smallest) drawdown
    'mean': -0.18,
    'median': -0.16,
    'std': 0.08,
    'percentile_5': -0.35,
    'percentile_95': -0.08
}Get confidence intervals for the simulation paths:
# 95% confidence band
lower, upper = mc.confidence_band(0.95)

# specific percentile path
p10 = mc.percentile(10)  # 10th percentile path
p90 = mc.percentile(90) # 90th percentile pathPlot all simulation paths:
qs.plots.montecarlo(returns, sims=500, seed=42)

# or from an existing result
mc.plot()
Plot terminal value distribution:
qs.plots.montecarlo_distribution(returns, sims=500, seed=42)After calling qs.extend_pandas(), you can use Monte Carlo directly on Series:
qs.extend_pandas()

# run simulation directly on a returns Series
mc = returns.montecarlo(sims=1000, bust=-0.15, goal=0.30)

# plot directly
returns.plot_montecarlo(sims=500)Get distributions of key metrics across simulations:
# Sharpe ratio distribution
sharpe_dist = qs.stats.montecarlo_sharpe(returns, sims=1000)
print(f"Sharpe range: {sharpe_dist['percentile_5']:.2f} to {sharpe_dist['percentile_95']:.2f}")

# Max drawdown distribution
dd_dist = qs.stats.montecarlo_drawdown(returns, sims=1000)
print(f"Drawdown range: {dd_dist['percentile_5']:.1%} to {dd_dist['percentile_95']:.1%}")

# CAGR distribution
cagr_dist = qs.stats.montecarlo_cagr(returns, sims=1000)
print(f"CAGR range: {cagr_dist['percentile_5']:.1%} to {cagr_dist['percentile_95']:.1%}")The raw simulation data is available as a DataFrame:
print(mc.data.head()) sim_0 sim_1 sim_2 sim_3 sim_4 ...
0 0.000000 0.017745 -0.002586 -0.005346 -0.042107 ...
1 0.002647 0.017795 -0.002398 0.004795 -0.034664 ...
2 0.003351 0.020711 0.002926 0.004868 -0.037902 ...
3 0.007572 0.029275 0.004323 0.012818 -0.044294 ...
4 0.010900 0.028764 0.009446 0.026309 -0.049399 ...
Monte Carlo simulation in QuantStats uses return shuffling:
- Take your historical returns
- Randomly shuffle the order of returns (preserving the distribution)
- Calculate cumulative returns for each shuffled path
- Repeat for N simulations
This approach:
- Preserves the exact return distribution of your data
- Breaks any time-series dependencies (autocorrelation)
- Shows the range of outcomes if returns occurred in different orders
- Helps quantify luck vs. skill in your strategy's performance
Note: Because shuffling preserves the product of all (1+r) values, the terminal value is the same across all simulations. What differs is the path taken to get there, which affects drawdowns, Sharpe ratios, and other path-dependent metrics.
Run Monte Carlo simulation on returns.
Parameters:
returns: pd.Series of daily returnssims: Number of simulations (default: 1000)bust: Drawdown threshold for bust probability (e.g., -0.20)goal: Return threshold for goal probability (e.g., 0.50)seed: Random seed for reproducibility
Returns: MonteCarloResult object
| Property | Description |
|---|---|
data |
DataFrame with all simulation paths |
original |
Series with original cumulative returns |
stats |
Dict with terminal value statistics |
maxdd |
Dict with max drawdown statistics |
bust_probability |
Float (if bust threshold set) |
goal_probability |
Float (if goal threshold set) |
| Method | Description |
|---|---|
percentile(p) |
Get p-th percentile path |
confidence_band(level) |
Get (lower, upper) confidence bounds |
plot(**kwargs) |
Plot simulation paths |