Applying different machine learning models in predicting the breast cancer among the women of different region and different age.
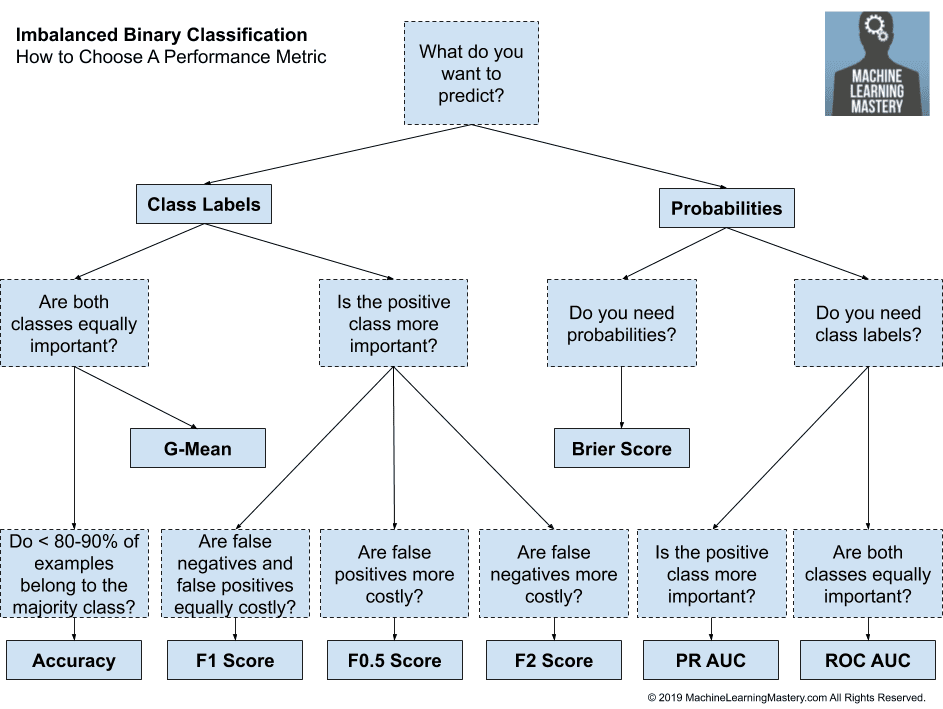
Problem Statements :- To build a breast cancer classifier on an Breast Cancer Winscoin dataset that can accurately classify tumor as benign or malignant based on the dataset given by here.
Real-world/Business objectives and constraints:- The probelm we have to look in the prespective as mentioned below.
- Interpretability is important.
- Errors can be very costly.
- Probability of a data-point belonging to each class is needed.
• Introduction
* Who ay risk?
* Treatment
•	Dataset Description
•	Visualization
•	Statistical Analysis
      * Correlation
      * Multicoleniearity
      * Normality test
      * Simpson's paradox
•	Modelling
•	Logistic Regression
•	KNN
•	SVM
•	Decision Tree
•	Random Forest
Introduction: Breast cancer arises in the lining cells (epithelium) of the ducts (85%) or lobules (15%) in the glandular tissue of the breast. Over time, these in situ (stage 0) cancers may progress and invade the surrounding breast tissue (invasive breast cancer) then spread to the nearby lymph nodes (regional metastasis) or to other organs in the body (distant metastasis). If a woman dies from breast cancer, it is because of widespread metastasis. To solve the above problem I have used many statistical techniques in order to come up with good reasoning. Initially I have checked for missing values, data pre-processing, data transformation, correlation among the features, multicollinearity, slicing the dataset, and then models were used to bring out the desire outputs. Since different classifiers were used like Logistic , Naïve bayes, KNN, Decision Tree, Random Forest, SVM and Boosting. Besides that important metrics related to the particular models were also used to check and compare which model is working very well with datasets.
Who is at risk? Breast cancer is not a transmissible or infectious disease. There are no known viral or bacterial infections linked to the development of breast cancer. Certain factors increase the risk of breast cancer including increasing age, obesity, harmful use of alcohol, family history of breast cancer etc.
Data Overview Dataset has been collected from open source and is available at through the UW CS ftp server : ftp ftp.cs.wisc.educd math-prog/cpo-dataset/machine-learn/WDBC/. Besides that it is also available at Kaggle. WE have single file of dataset which contains 32 features and have 532 rows. Since onne of the columns is response variable while rest of them are explanatory variables.
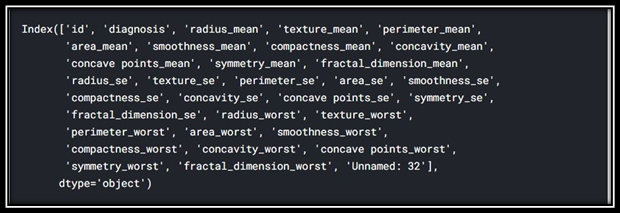 It contains 32 features and 532 rows.
Explanatory and Response variable As we can see that there
| Features | variables Type |
|---|---|
| diagnosis | Response |
| rest 30 features | Expalanatory |
Response Variables:- :- It can bee see that 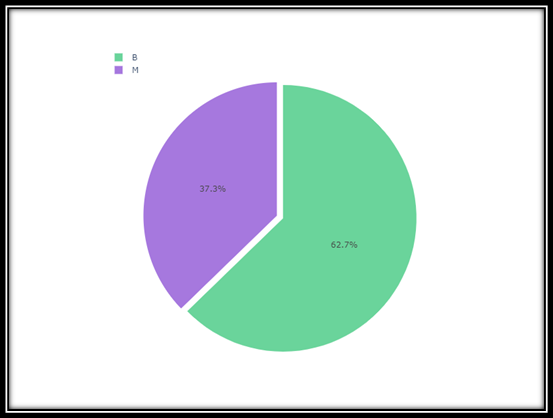 From the figure it can be observed that there “B” is 62% while “M” is almost 38%. We can see a kind of data imbalanced. Though in our analysis I have considered two cases
Missing Values:- After carefully analysing the dataset we have seen that it is perfect dataset which contains no null values. Hence our work became easy as no imputation has been performed here.
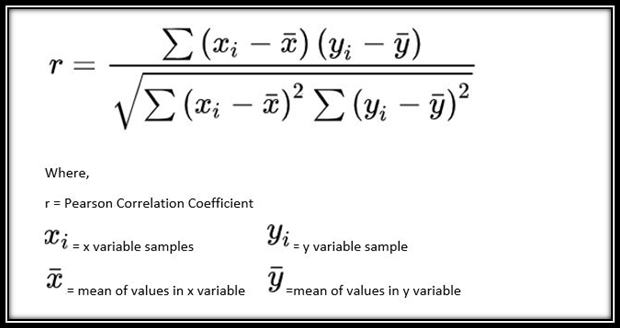
Pearson’s Correlation Coefficient:- To find out the relationship between the response variable and each explanatory variable
 .
.
-
Case-1: when r=-1, it shows that both the variables are negatively correlated. With the increase of the one variable other will decrease.
-
Case-2: when r=0, it shows that both the features are independent.
-
Case-3: When r=1, it shows that both the features are highly related.
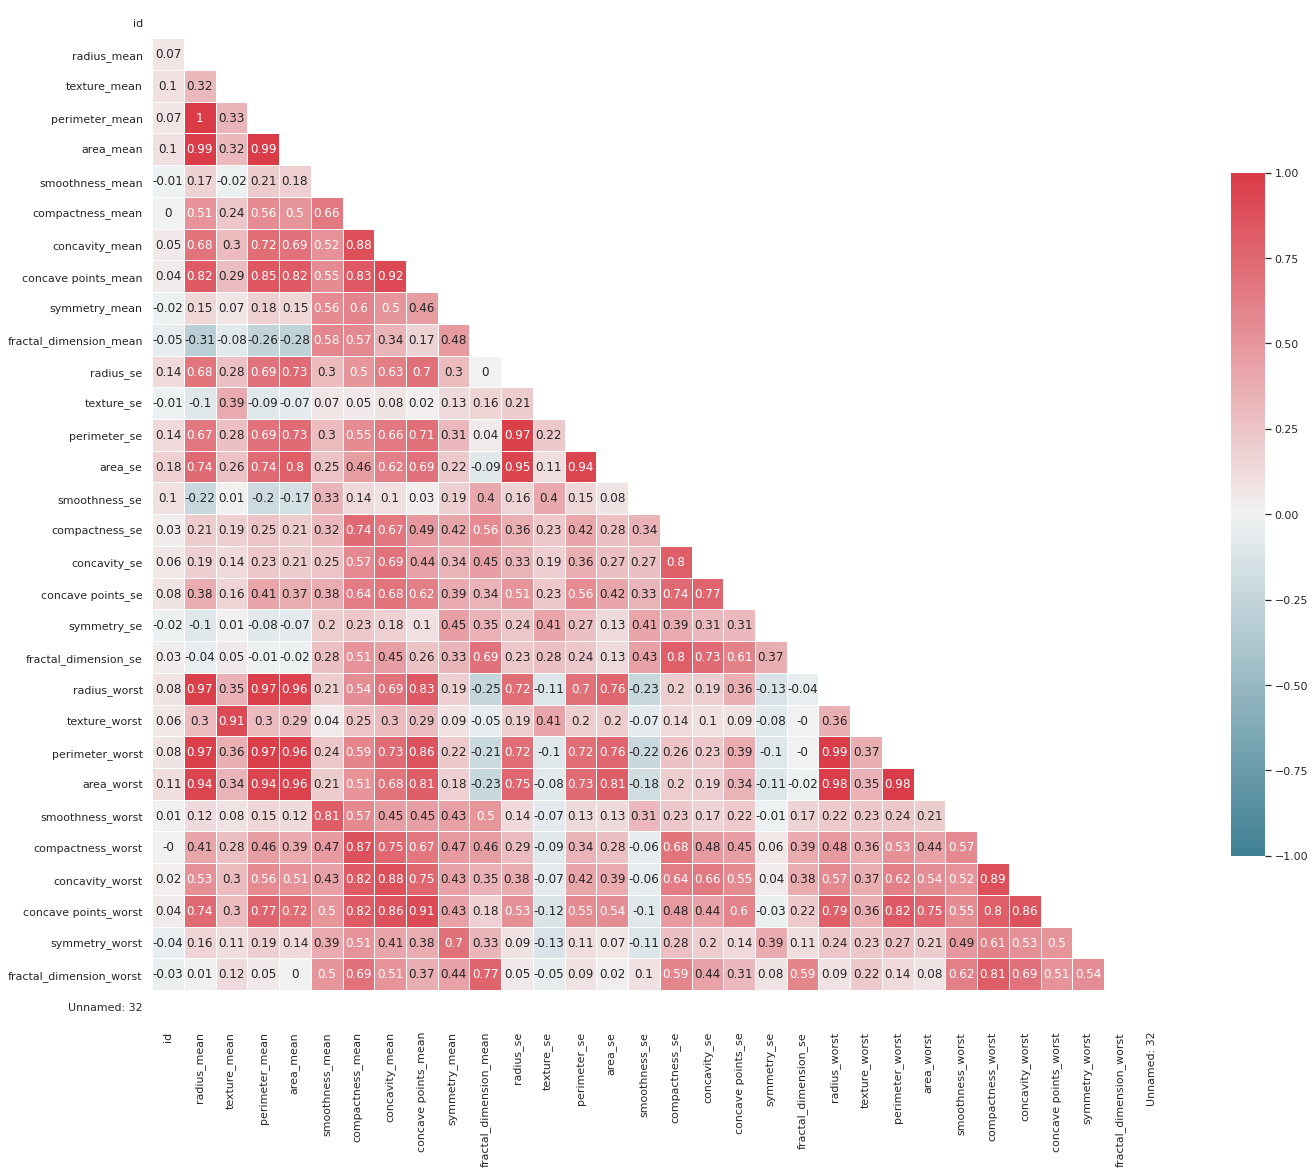
Spearman’s Correlation Coefficient :- it is same as with Pearson’s correlation coefficient.
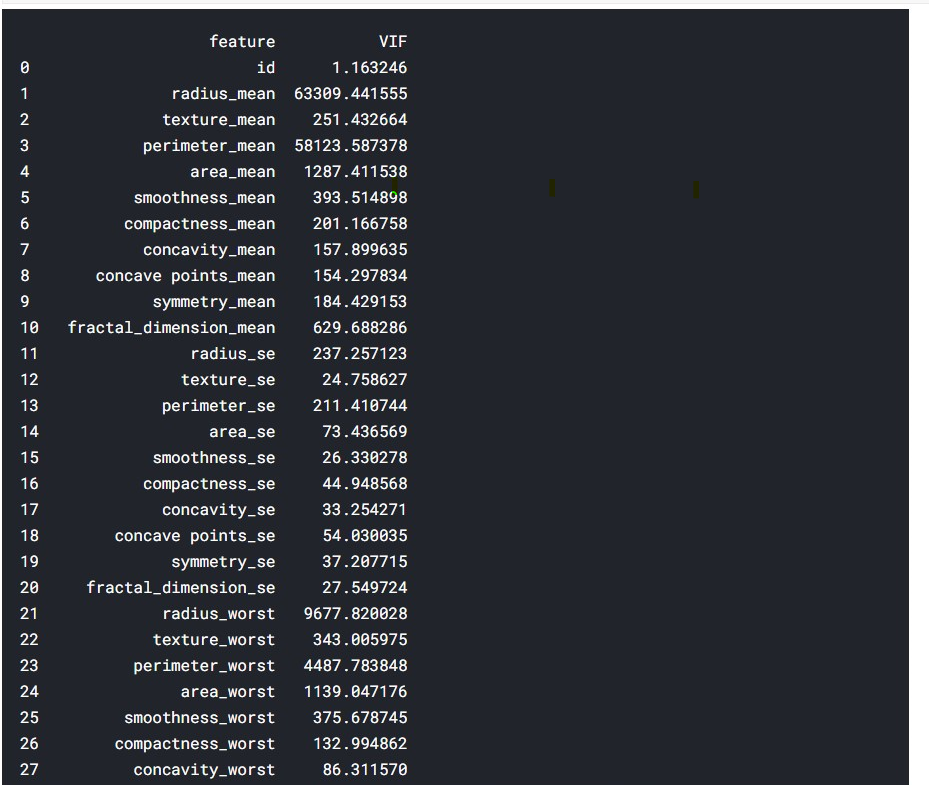
Multi-colinearity: As we can see that there many features in the dataset i.e. there are 32 features including the response variable. There is high chance that there might be multicolinearlity among the features. To detect the multicolinearlity we have multiple options. • Variance inflation factor (VIF) measures how much the behaviour (variance) of an independent variable is influenced, or inflated, by its interaction/correlation with the other independent variables. • 1 = not correlate. • Between 1 and 5 = moderately correlate. • Greater than 5 = highly correlate.
- VIF> 10 is used and remove the feature which has that high VIF.
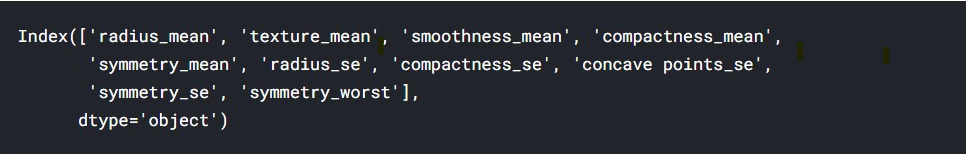
Normality-Test :- • In our case VIF is not working well. So I have chosen an alternative option. We have to perform some statistical analysis. We have to calculate the p-value for each feature. We remove those features which have higher p-value. • Next is normality test is performed for each of the variables. Those features which do not follow the Gaussian distribution will be not used for the modelling. To perform the normality test, we can use QQ plot, distribution plot and histogram. Beside that some KS test and chi-square goodness of fit are also performed
Q-Q plot and Shapiro-Wilk Test
Simpson's Paradox:- We have done slicing of the dataset in order to observe a particular trends in dataset or some kind of the distribution which might be not avilable with the whole dataset. It is called as simpsons's paradox. In my case I didn't find such paradox.
-
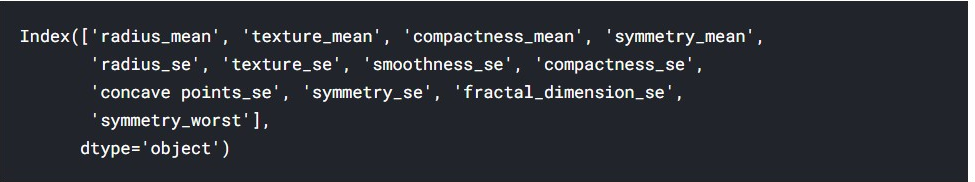
I have done two way of selection method. Forward and backward selectionmethod , these two have been mentioned belwo
-
Forward subset slelction Method: -
-
Backward step selection Method:-
Model :- I have used different models for classfication. Logistic Regresion, KNN, Naive Bayes, Decision Tree, Random Forest SVC