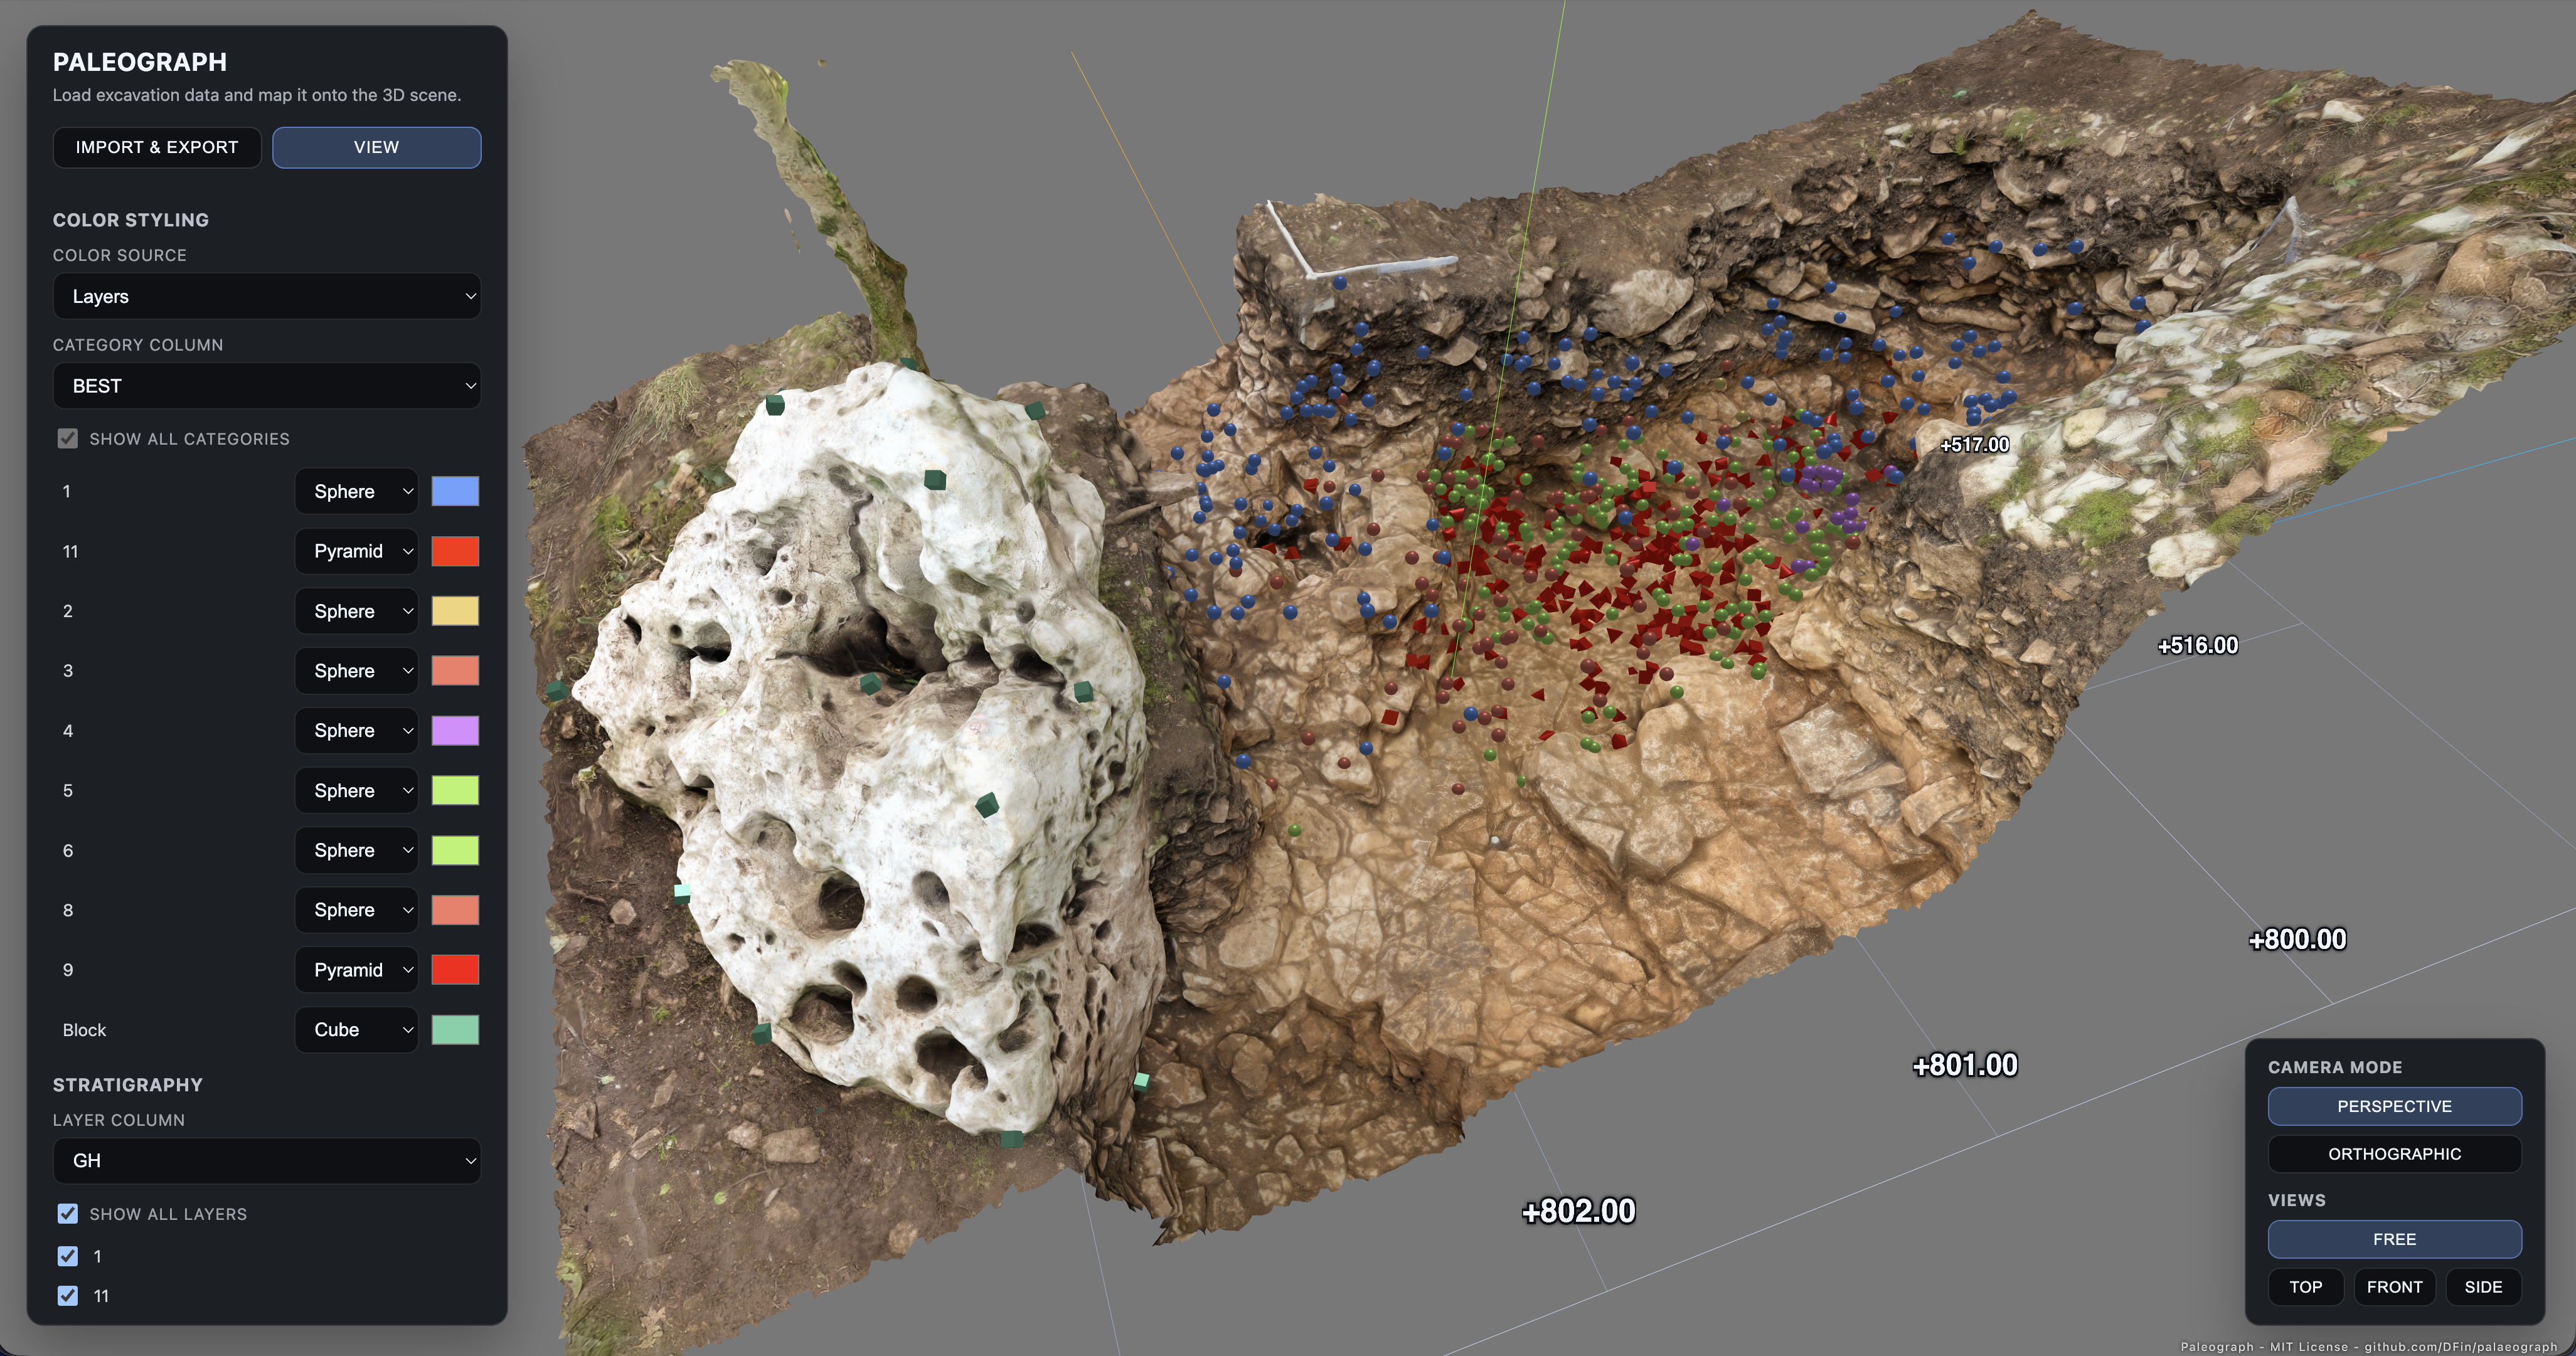
Paleograph is a browser-based 3D viewer built for archaeologists who need to explore excavation datasets without leaving the trench. It accepts CSV exports that contain stratigraphic layers, find categories and spatial coordinates, then renders each find as an interactive object in a Three.js scene. The interface runs entirely on a static host, so all analysis stays on the workstation that serves the files.
- Rapid inspection of context sheets or trench notebooks exported as CSV.
- Comparing finds across stratigraphic layers to identify depositional patterns.
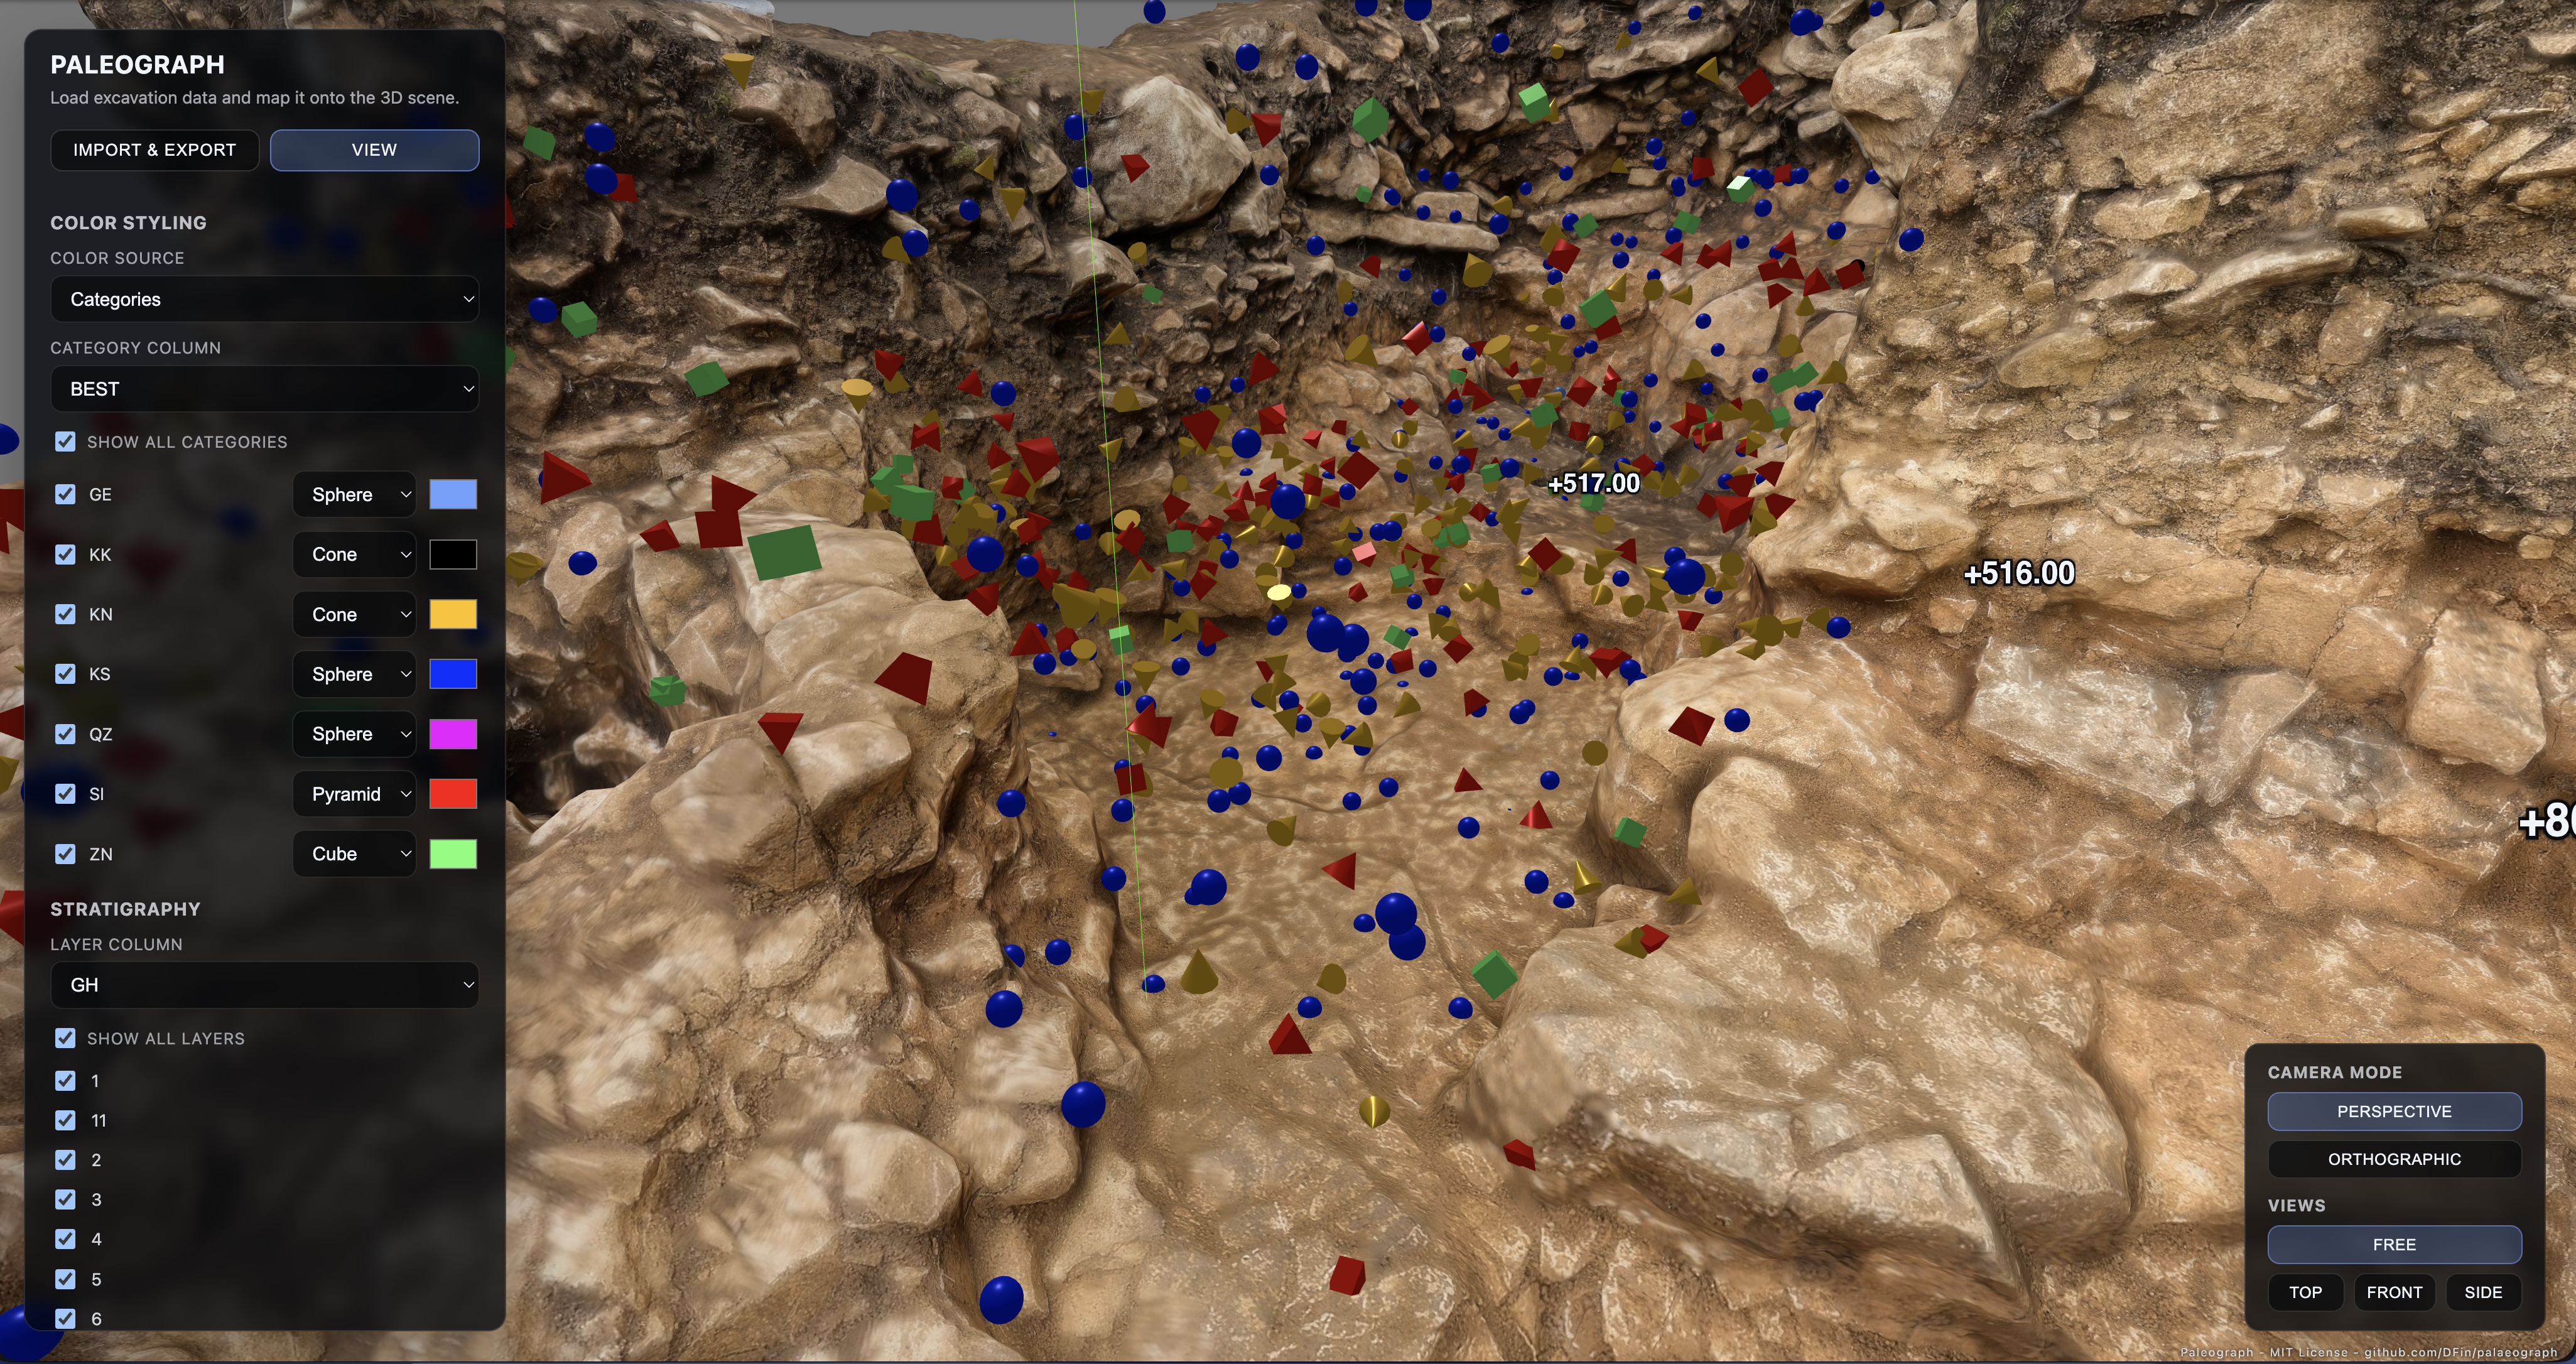
- Highlighting artefact categories (bone, lithic, ceramic, etc.) using custom geometry and colour schemes.
- Filtering layers for presentation or field discussion.
- Export currently viewed or all datapoints as colored ply pointcloud for external usage in Meshlab or a CAD application
- Completely local No data is uploaed. The whole program runs locally in your browser.
- Inline CSV upload (drag & drop or file picker) with automatic header detection.
- Axis mapping for East, North and Elevation columns, honouring geospatial orientations (no coordinate normalisation).
- Colour modes: toggle between category-based styling and layer-based styling, each with editable palettes and geometry.
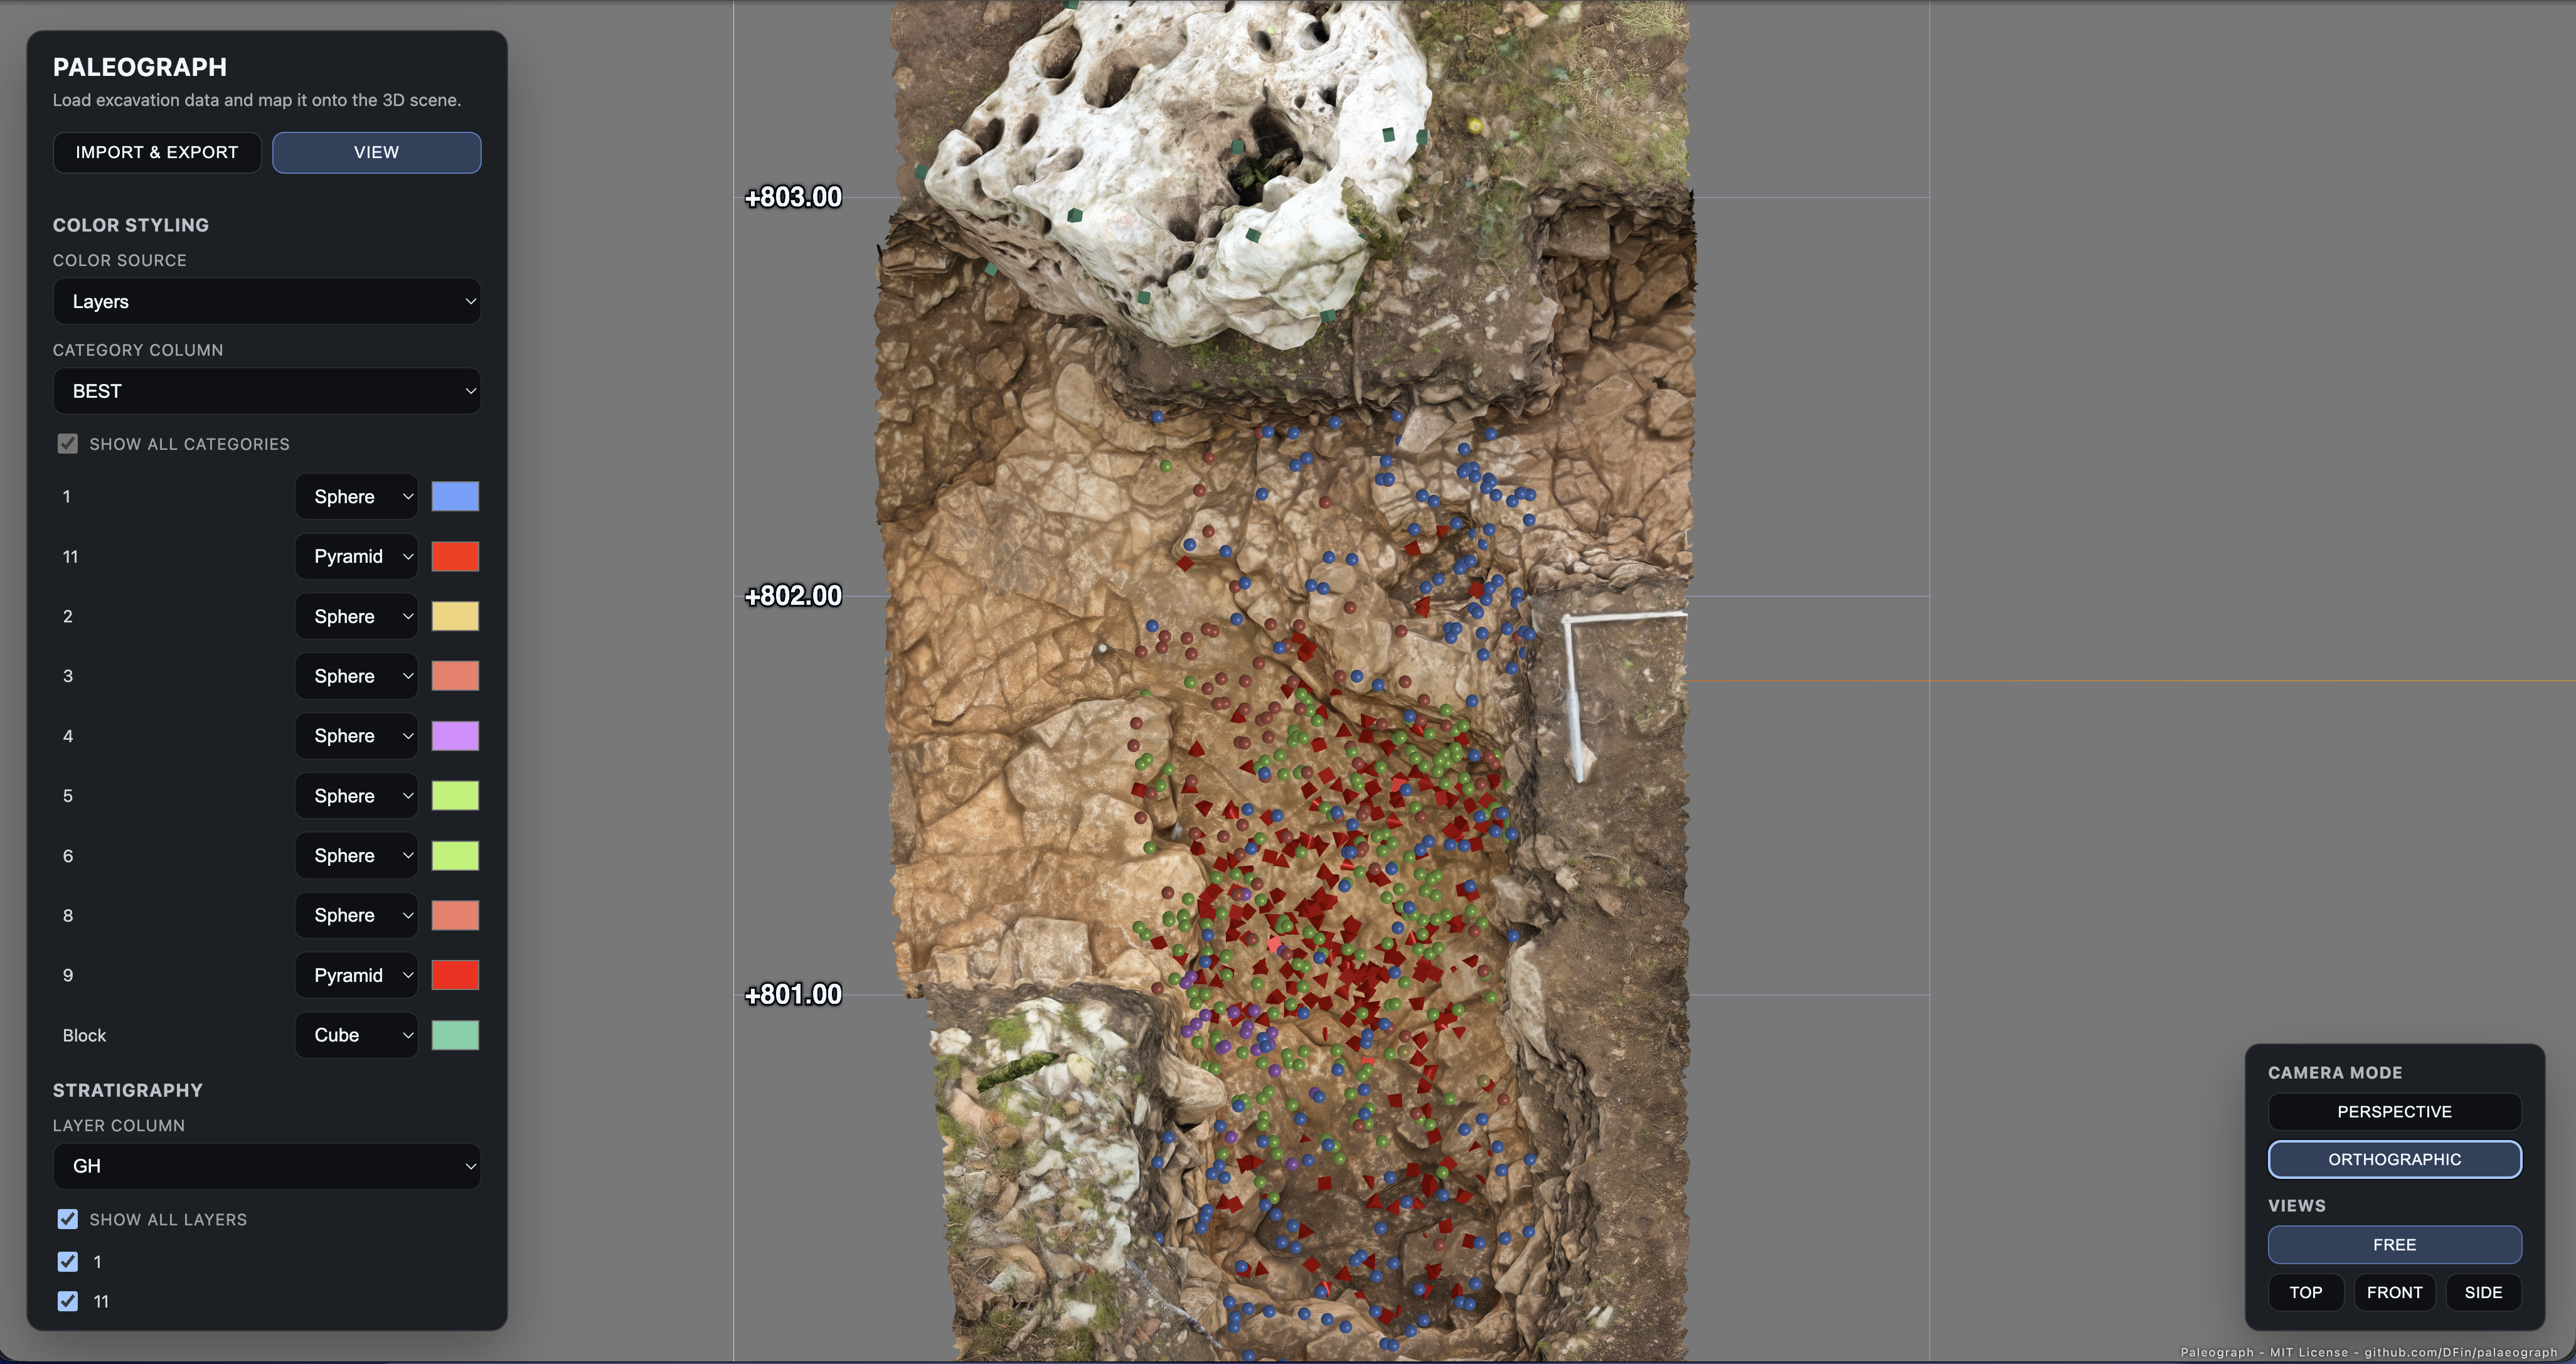
- Stratigraphy filters to show/hide layers without resetting the camera.
- Camera presets (top, front, side, free) plus orthographic/perspective switchers that preserve your chosen viewpoint.
- Scalable visuals: point and label size sliders with adjustable ranges
- Meter-based ground grid and bounding-box labels that track the visible dataset.
- Based on Three.js (https://threejs.org/) - the awesome Open Source 3D library
-
Access the application by doing any of the this:
- Go to paleograph.noelith.dev using a modern browser (Chrome recommended)
- Download the latest release and run it on your own http server (Details below)
-
Drop a CSV file onto the interface.
-
Map columns for East (X), North (Y), Elevation (Z), Category and Layer.
-
Adjust styling:
- In Categories mode, toggle visibility, assign shapes/colours per artefact type.
- Switch to Layers mode to style by stratigraphic horizon instead.
-
Use the layer checklist to isolate horizons while the camera stays fixed.
-
Tune point/label scales using the sliders or expand their range with the min/max inputs.
-
Jump between camera presets or stay in free orbiting mode to explore the dataset.
-
(Optinal): Load photogrammetry or meshed LIDAR scans as OBJs.
- Must include numeric columns for East, North and Elevation. Headers named
X,Y,Zare auto-selected; otherwise choose them manually. - Category and Layer columns may be textual or numeric. Unique values are detected automatically.
- Empty rows are ignored. Non-numeric coordinate cells are skipped.
Feel free to submit bug reports and feature request via github issues.
Also feel free to do pull requests. Since I dont work in archeaology anymore mainting this is not my highest priority. Would be happy to hand over "core maintainer" to someone more close to archeolgy.
For any questions contact d.finsterwalder ( at ) gmail.com
The whole application runs local in your webbrowser. Nothing is ever uploaded or otherwise send to the webserver. Despite this you can't just open the index.html file and still need a server to run it for the reasons below.
Modern browsers sandbox files loaded via the file:// scheme. ES module scripts, import maps and cross-file requests are blocked in that mode, so opening index.html directly from Finder/Explorer results in an empty page. Serving the folder over HTTP keeps everything on your machine but satisfies those security checks.
-
Download a release or if you are into git clone the repositary.
-
From the project root, start the built-in server in your terminal / command line:
python3 -m http.server 5173
-
Visit
http://localhost:5173/in your browser. -
To stop the server in your Terminal use
Ctrl+C.
Pick whichever toolchain you already have installed:
- Node.js:
npx http-server . -p 5173 - Node.js:
npx serve . --listen 5173 - Bun:
bunx serve --port 5173 - Rust:
basic-http-server . 5173(install once withcargo install basic-http-server)
All of these commands run entirely on the local workstation; nothing is uploaded anywhere.
- Tools like
vite previeworlive-serveradd live reload while you edit. - Wrap the static server behind
mkcert, nginx, or Caddy if you need a HTTPS server so tablets on the site can access the server running on your laptop. - To share across a local network, expose the port and share the LAN URL (example:
http://192.168.1.50:5173/).
If you can't get it to work and are desperate for help feel free to reach out to me: d.finsterwalder ( at ) gmail.com
| Path | Purpose |
|---|---|
index.html |
Entry point that wires the overlay UI to the Three.js scene. |
src/main.js |
CSV parsing, UI state management, colour logic, camera controls. |
src/sceneManager.js |
Three.js scene setup, geometry generation, grid/label rendering. |
src/style.css |
Overlay layout, sliders, buttons and typography. |