Team week experiments #1
Description
Our Forests Tomorrow - January Experiments
Approach
Based on the early prototype built by Erik this summer, as well as the designs and ideas developed by Fausto in november/december, we would like to develop a series of independent and narrowly focused experiments, each testing a design and/or technical concept, with the immediate objective of presenting the results for Team Week in February 2023.
Goals
“The Experiments Experiment”: iterate and reflect on a process that could be reused in some future Labs projects:
- By developing each Experiment as a standalone mini-project that requires the least possible amount of context and the least possible engagement, maximise the potential for any DS team member to pick up an experiment, work on it, and have fun 🙂
- Multiply avenues for comms opportunities, each experiment potentially developing into social media posts, blogpost, public notebook, etc.
- Expand DS publicly identified key competencies on new areas.
- Optimise reusability of core techniques developed as Experiments for other DS projects.
- Multiply potential exits in case the project never sees the light as a standalone viable product, either comms or core techniques but also as standalone spinoffs in the context of the productization strategy.
Experiments
1. In-text variables
frontend - owner: ?
Integrate dynamic variables generated from stats into a natural sentence (ie “executive summary”) with support for i18n. Interesting for accessibility.
| Concept | Design | Interactive prototype | Post mortem |
|---|---|---|---|
| ✅ | - | ⏳ visible in the early prototype. Need to isolate and generalize. logic |


2. Scrollytelling introduction
Design/frontend - owner: ?
Explain overall context of the study's context, goals, and extent using narration and progressive disclosure of charts, map and UI elements using the native browser scroll behavior.
| Concept | Design | Interactive prototype | Post mortem |
|---|---|---|---|
| ✅ | ⏳ | ⏳ very rough idea of it in the early prototype |

3. Skeuomorphic chart (“Tree rings” dataviz)
Design/frontend - owner: ?
Chart species state of coverage (stable/decolonize/suitable) using a “tree rings” chart.
| Concept | Design | Interactive prototype | Post mortem |
|---|---|---|---|
| ⏳ | ⏳ |

4. Illustrations using deep learning model(s)
Design/scripting - owner: Erik/Fausto
Use OpenAI APIs (or similar) to produce illustrations for 67 tree species, including silhouette, fruit, leaf, bark, flower etc in a given style. Check that depictions are accurate enough.
Also postmortem as a design inspiration technique?
| Concept | Design | Interactive prototype | Post mortem |
|---|---|---|---|
| ✅ | ⏳ | ⏳ |


5. Visual design: visual exploration in line with old botanical illustration manuals
Design/frontend - owner: ?
- Explore the use of classic typographies, noise textures and layouts to convey the feeling of reading an old botanical illustration manual, something that transcends the current times —very much like a forest 🙂.
- Sources of inspiration:
- The work of Nicholas Rogeux
- Where the Animals Go book
- Audubon’s Bird Migration Explorer website
- Chartogne-Taillet winery website
- Robert Bringhurst’s book The Elements of Typographic Style
- Edible Forest Gardens books
| Concept | Design | Interactive prototype | Post mortem |
|---|---|---|---|
| ⏳ | ⏳ |


6. High quality map rendering techniques
Design/frontend - owner: Erik/Fausto
Create an emotional connection with the study and the dataset using a carefully crafted interactive map.
- Render gridded data as a smooth “chorology maps”
- animate?
- Fill areas with seemingly randomly positioned icons (without cutting them)
- Render gridded hexagon as extruded geometries (show non-discrete value)
- Globe projection
⚠️ tightly coupled with “deck.gl as the map rendering engine”
| Concept | Design | Interactive prototype | Post mortem |
|---|---|---|---|
| ⏳ | ⏳ | ⏳ started work in this Observable notebook |

Custom Mapbox studio style (WIP)

15x15px Mapbox Studio Maki-style icons for the different map categories (WIP)

7. Beeswarm plot
Design/frontend - owner: ?
Chart species distribution in a given area as a beeswarm plot
| Concept | Design | Interactive prototype | Post mortem |
|---|---|---|---|
| ✅ | ⏳ | ⏳ PoC in the early prototype (bottom of the page) |

8. Map compare for the two available RCPs
Design/frontend/data - owner: ?
| Concept | Design | Interactive prototype | Post mortem |
|---|---|---|---|
| ✅ | ⏳ |

9. deck.gl as the map rendering engine
frontend - owner: ?
| Concept | Design | Interactive prototype | Post mortem |
|---|---|---|---|
| ⏳ | - | ⏳ deck.gl currently used in the early prototype |
10. React in Observable?
frontend - owner: ?
Observable is a great tool for experiments/labs projects: how can we leverage it's capacities while making the transition to a typical frontend React app easier?
See https://observablehq.com/@tmcw/state-of-react-in-observable
See https://observablehq.com/@tmcw/using-mapbox-gl-js
| Concept | Design | Interactive prototype | Post mortem |
|---|---|---|---|
| ⏳ | - | ⏳ currently using Mapbox GL in this Observable notebook |
11. GFW-like Geo describer?
Frontend/backend - owner: Isayah?
Reuse/interact with API/reverse-engineer the method used by GFW to dynamically generate human-readable biome/environment descriptions. Use OpenStreetMap/Overpass? More data sources?
| Concept | Design | Interactive prototype | Post mortem |
|---|---|---|---|
| - |

12. Dynamic vector tiles with TiTiler?
Backend - owner: ?
Design and implement an efficient vector tile format. In the early prototype, tiles are generated locally with QGIS and tippecanoe.
| Concept | Design | Interactive prototype | Post mortem |
|---|---|---|---|
| - |
13. Crowd-sourced internationalization
Frontend - owner: Erik
Useful in the context of producing products for the European market.
Set up a workflow with Github actions and a SaaS i18n platform (Crowdin) and integrate in the frontend (with English and French as the minimum, explore expanding to Spanish, Portuguese, German…)
| Concept | Design | Interactive prototype | Post mortem |
|---|---|---|---|
| ✅ | - | ✅ |
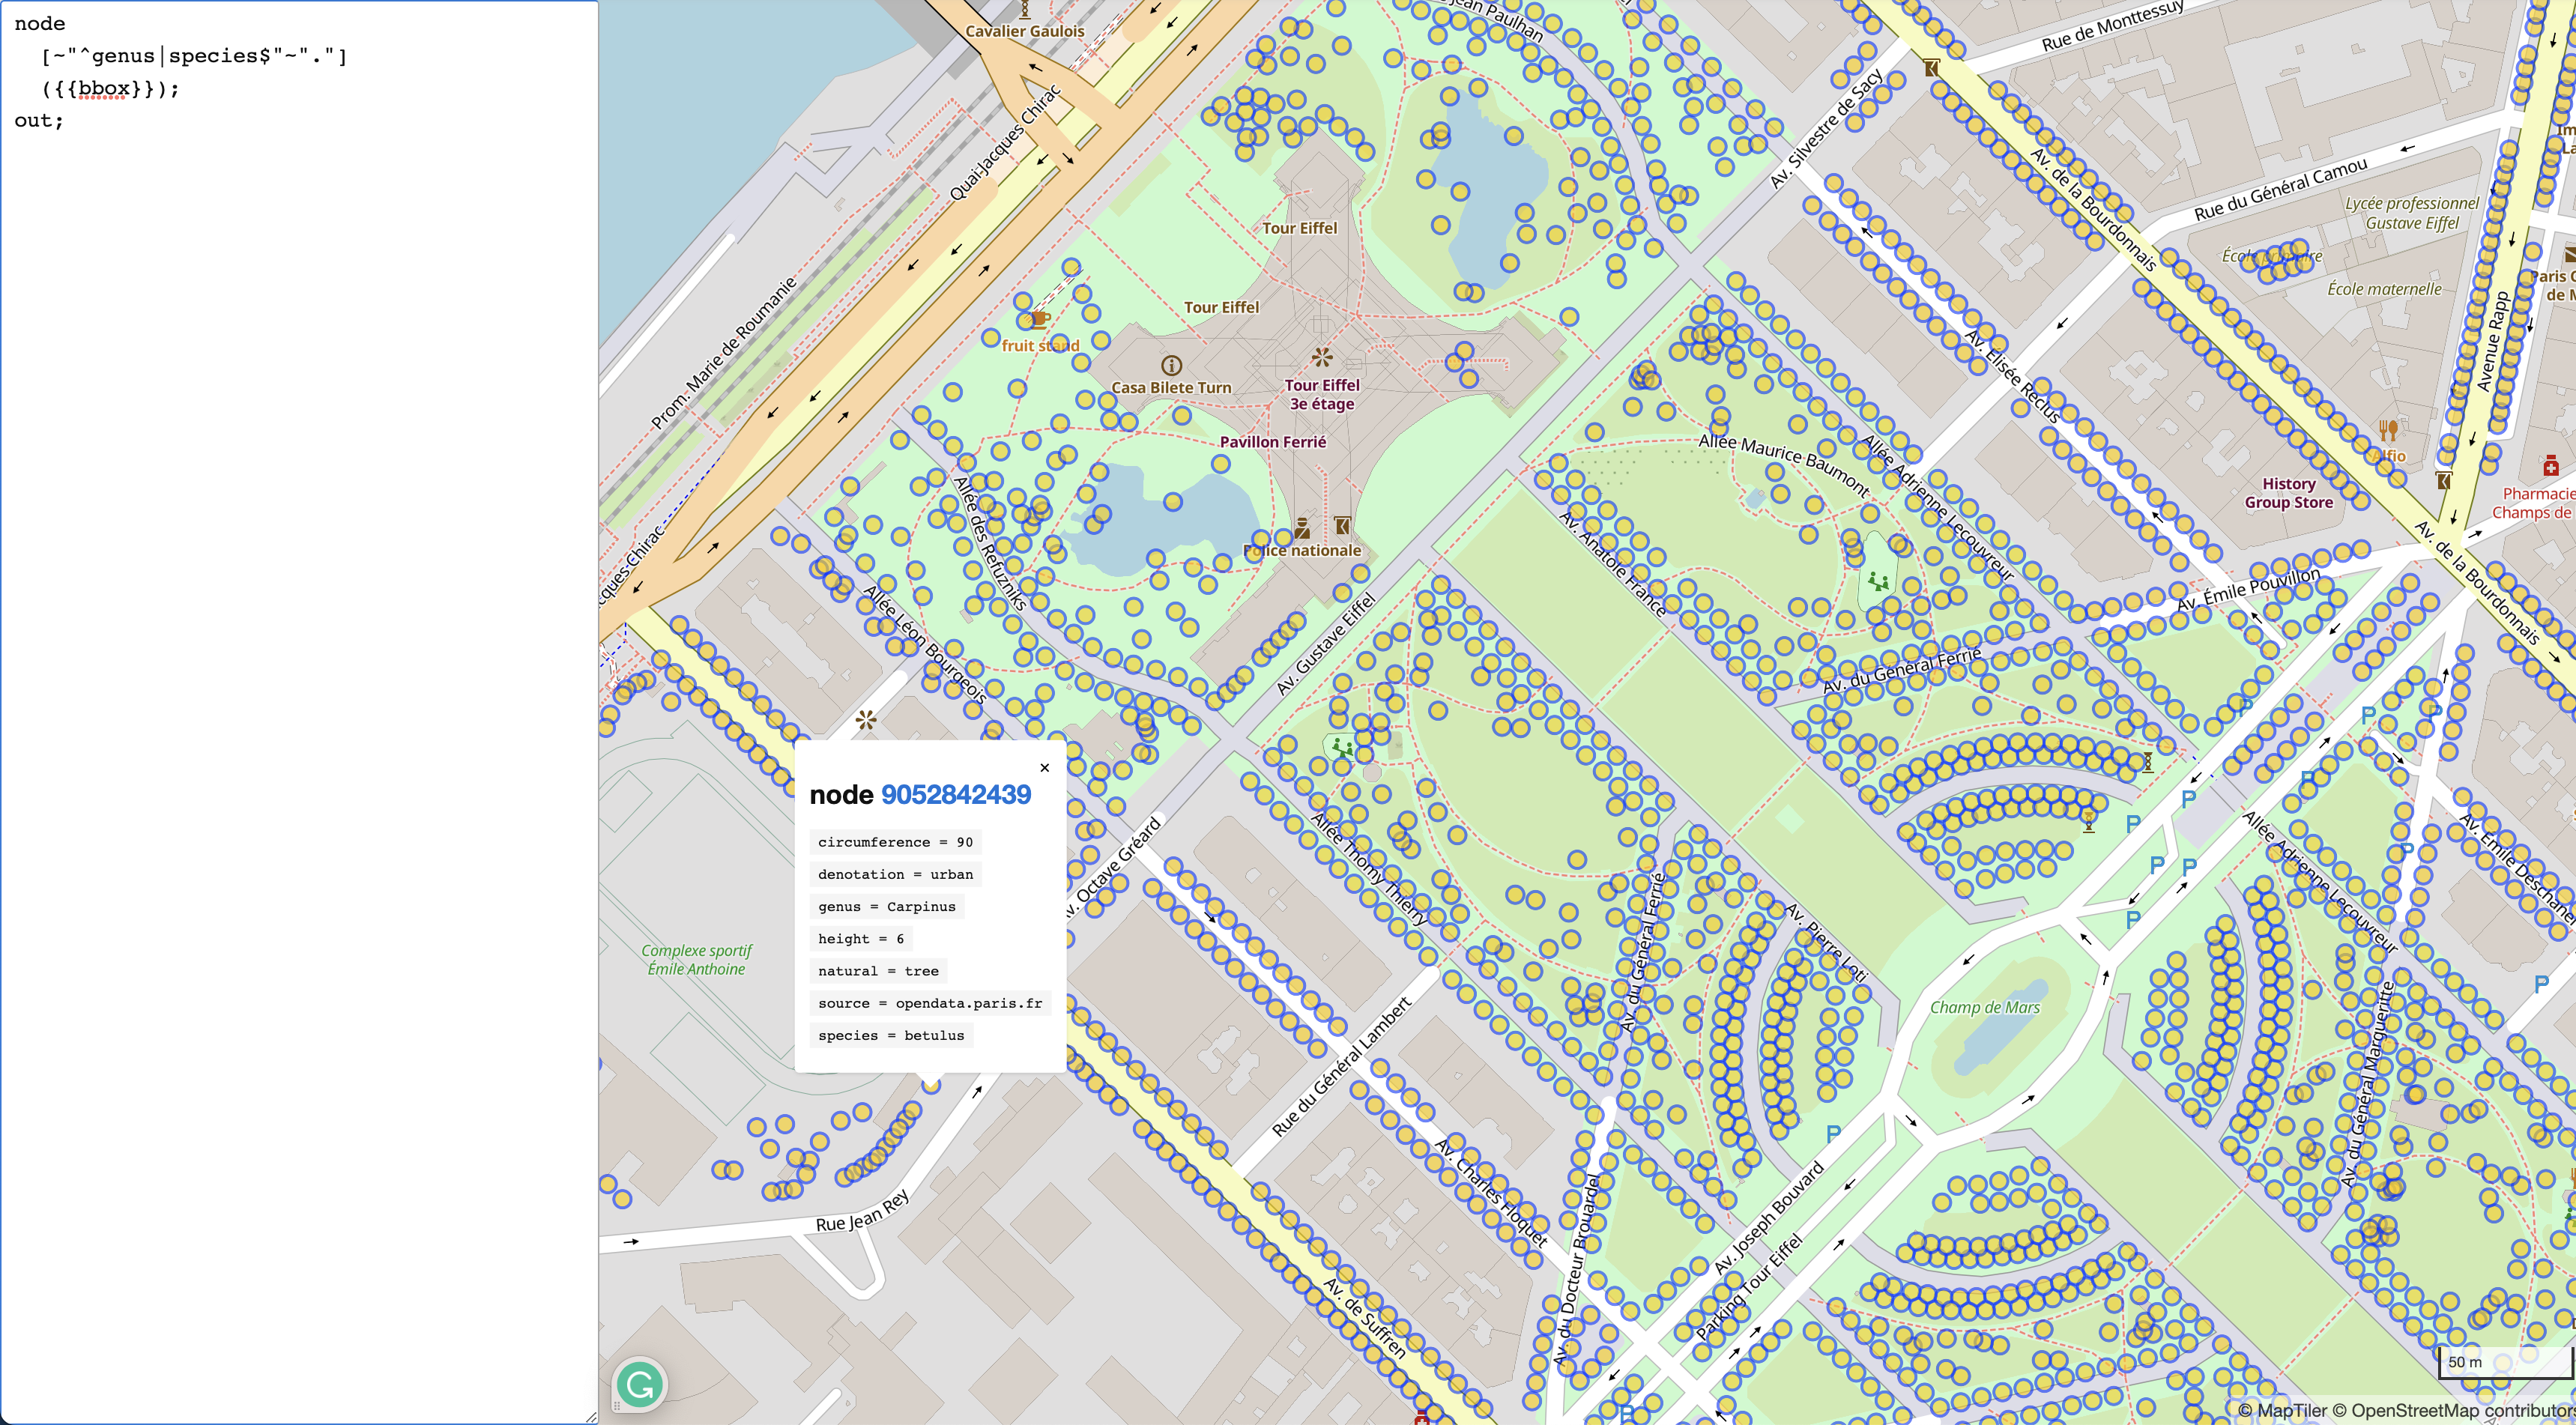
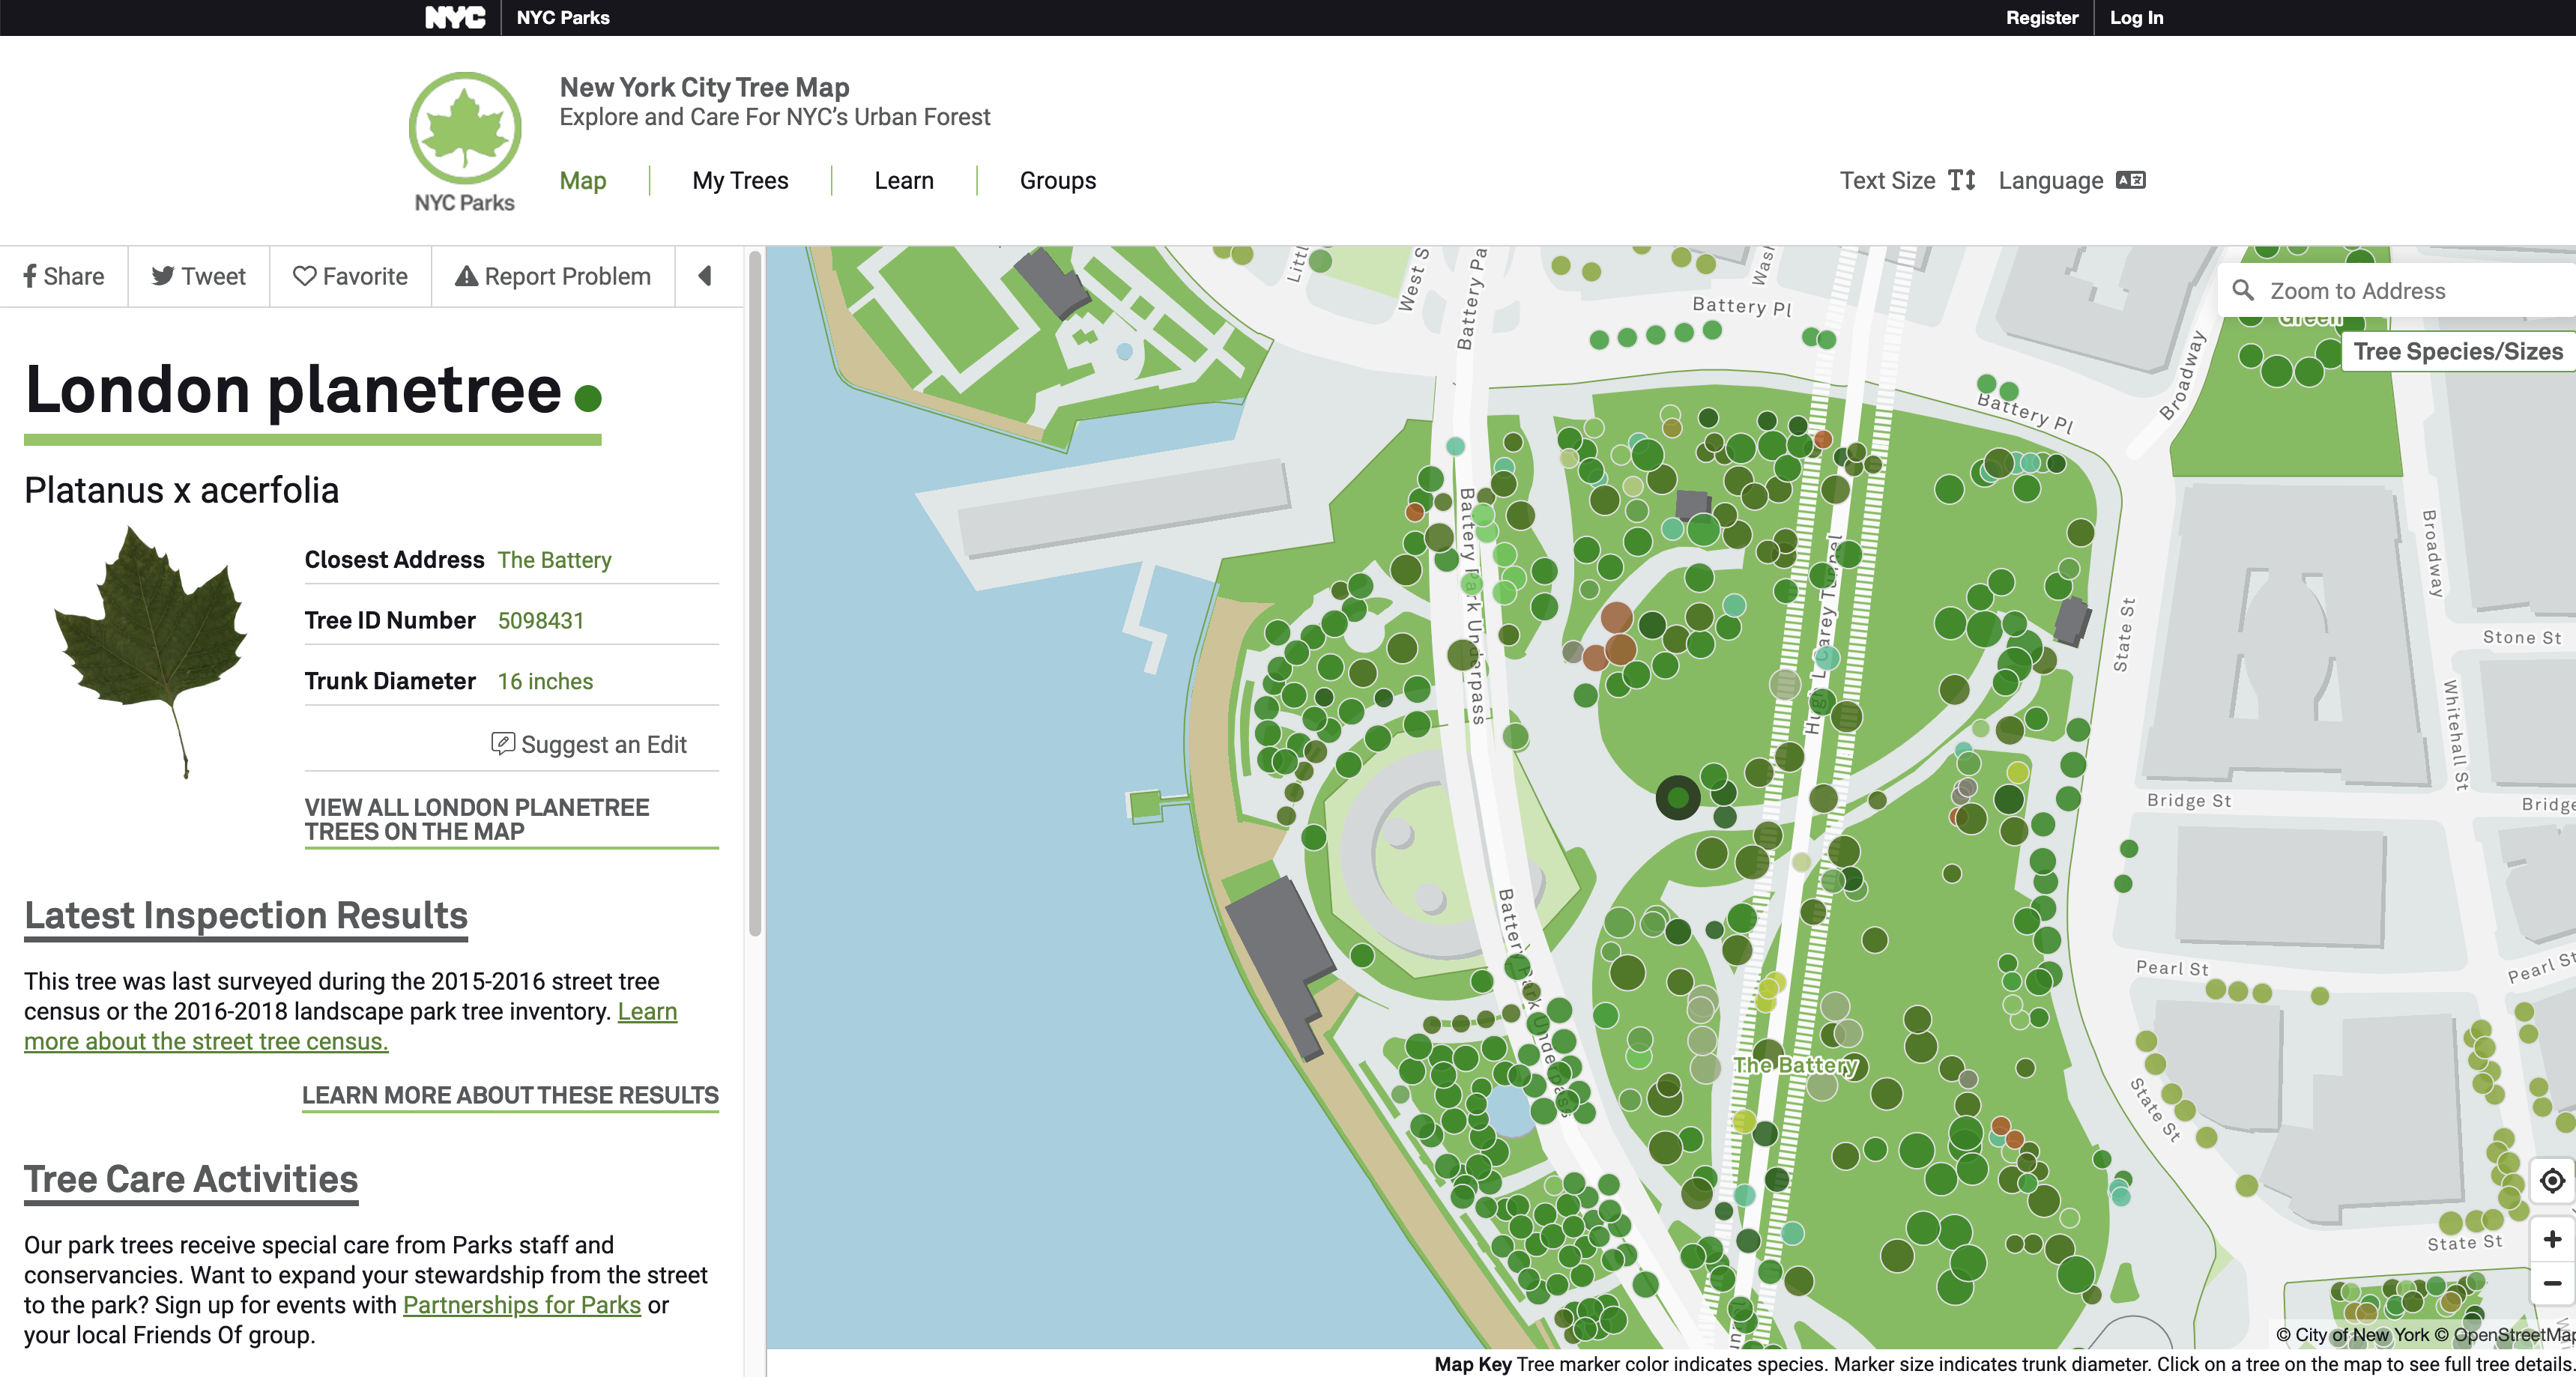
14. OSM Trees + EU-Trees 4F
Design/data/frontend - owner: ?
In a given European city, show what are the trees (at individual level) that are the most exposed to climate change, those that are the most likely to thrive and those that need extra care. To do that, cross-reference individual tree nodes present in OSM that have genus/species data with the results of the EU-Trees4F dataset. Inspiration: New York City Tree Map
| Concept | Design | Interactive prototype | Post mortem |
|---|---|---|---|
| ⏳ | - |
Impact/Effort Matrix

Bootstrapping Experiments
As Observable Notebooks? I’d like to be able to use at least React, in order to facilitate transition to a possible final product (ie I don’t want to rewrite d3 DOM-wrangling code into React components). There is a hack to use React in Observable, not sure how much we can rely on that.
Otherwise, build a barebones app with a template that provides no-nonsense hooks to access tilesets, the statistical dataset, regions geometries, species list and data, translations, etc.