
Panelist is a Rust library for writing Grafana dashboards as concise, strongly typed code.
use panelist::prelude::*;

let dashboard = dashboard! {
    title: "Service health";
    refresh: "30s";

    row "Traffic" {
        timeseries "Requests" {
            query: promql!("sum(rate(requests_total[$__rate_interval]))");
            unit: reqps;
            width: 12;
        }

        stat "Errors" {
            query: promql!("sum(rate(errors_total[$__rate_interval]))");
            unit: reqps;
            width: 12;
        }
    }
};

dashboard.validate()?;
dashboard.write_json("service.json")?;
# Ok::<(), panelist::Error>(())
Panel IDs, query reference IDs, and 24-column grid positions are assigned automatically and deterministically. The resulting JSON is stable enough to review in Git and close to Grafana's native dashboard model.
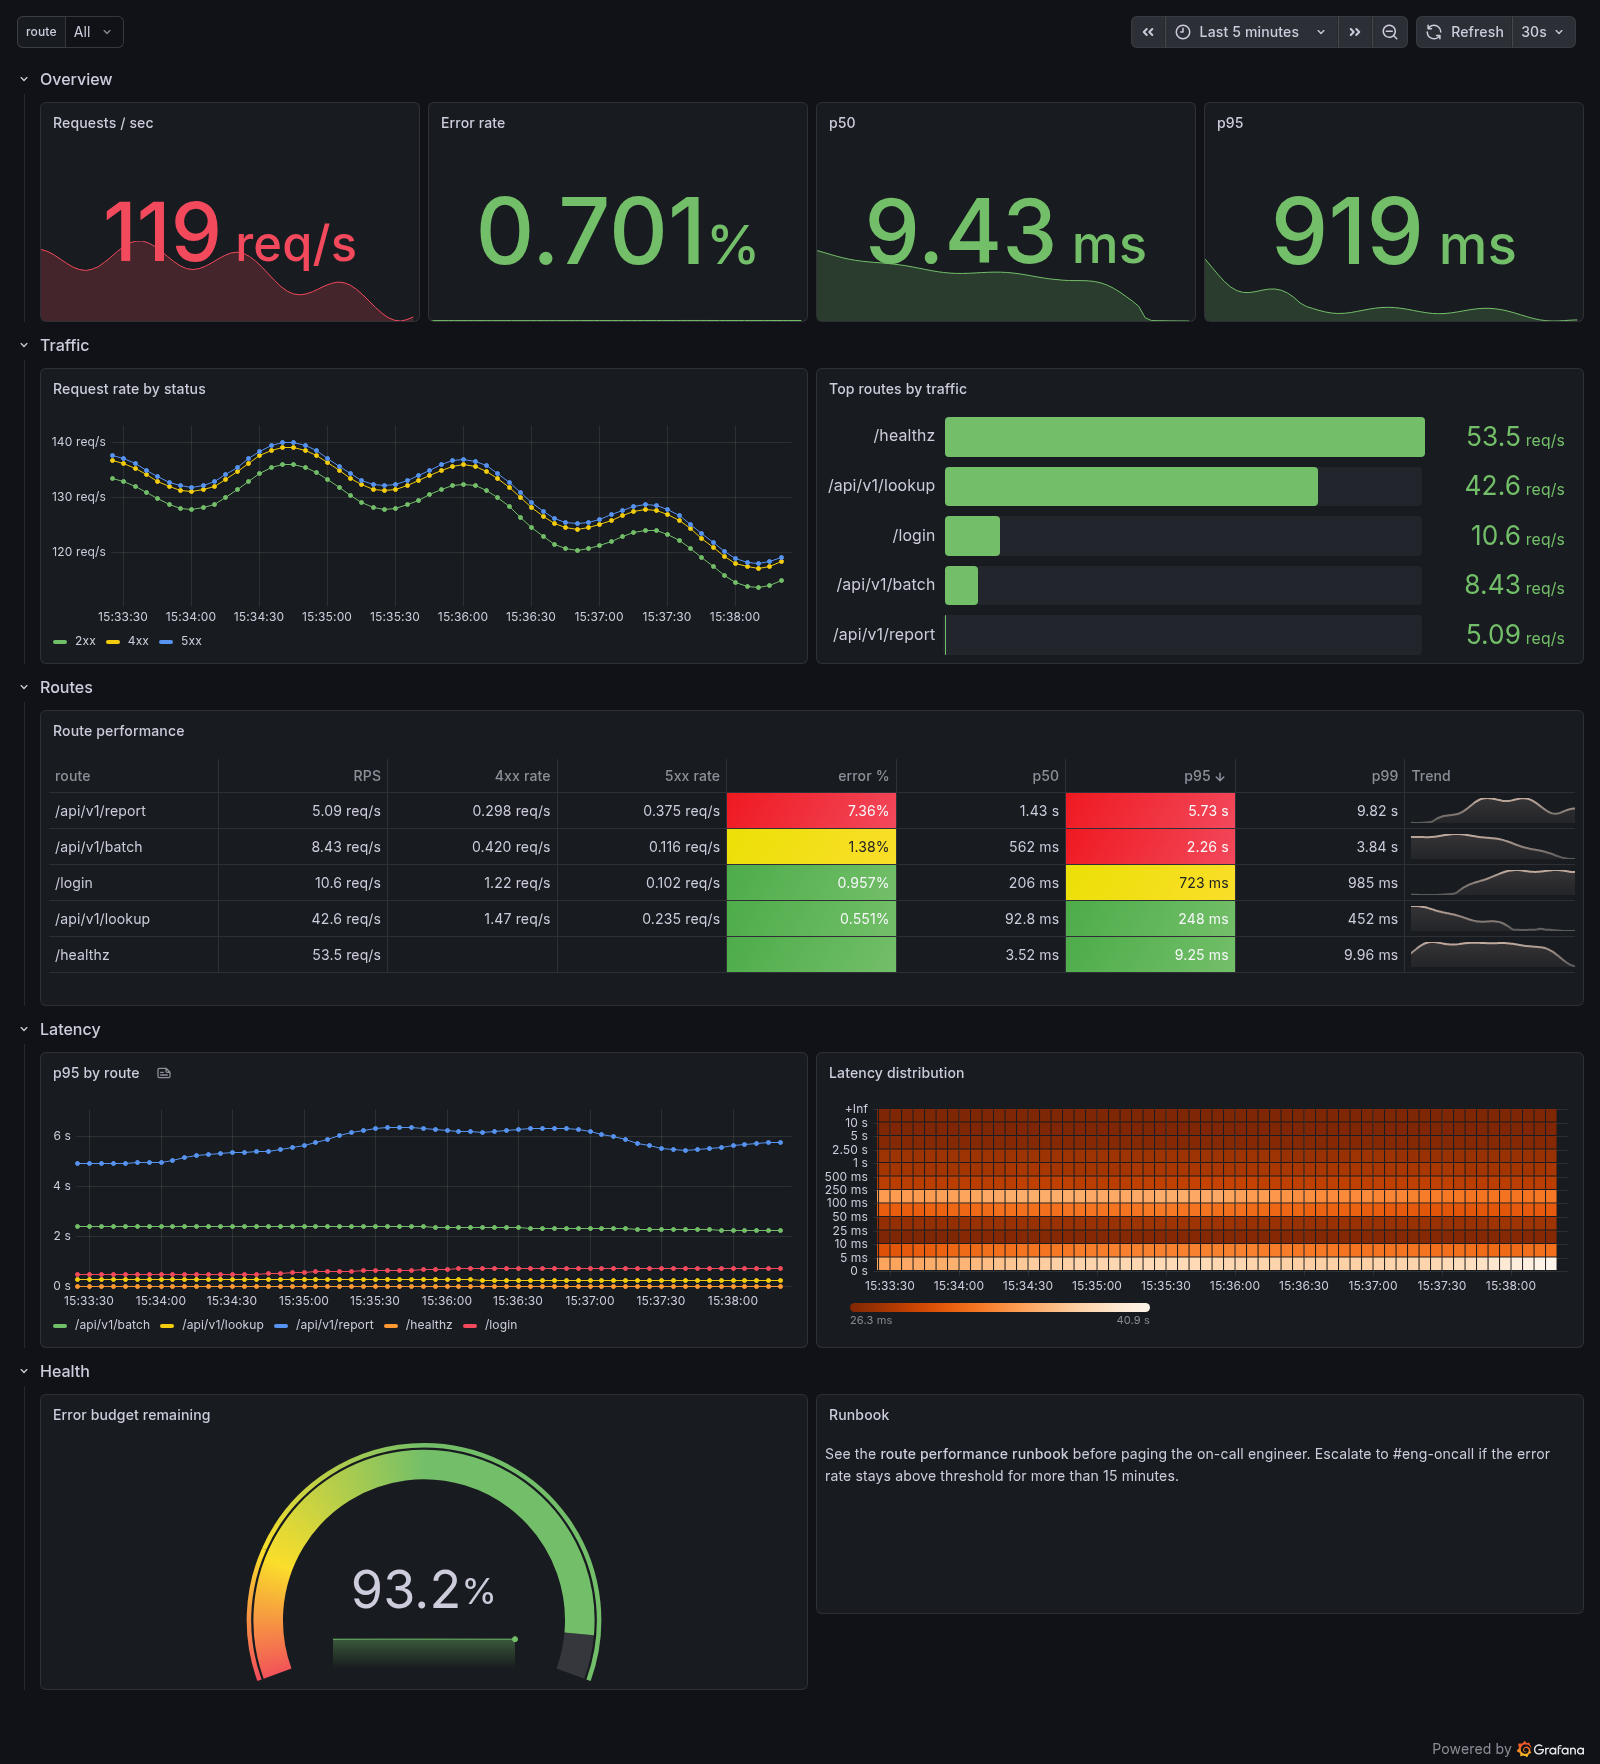
That screenshot is not a mockup. It is Grafana 13 rendering the output of
route_performance.rs, which
is regenerated by make render-examples. See the example
gallery for all six, or run make demo to click through
them on a live Grafana.
Panelist is under active development. Add the current release from crates.io:
cargo add panelistThe minimum supported Rust version is 1.96. Panelist uses Rust 2024 and has no async runtime or network client dependency.
dashboard! translates a small amount of syntax into ordinary typed builders. Every entry lowers to exactly one builder call, and every value is a Rust expression checked by the compiler where the builder receives it. The macro adds no loops or conditions of its own: Rust remains the composition language.
use panelist::prelude::*;

let dashboard = dashboard! {
    title: "API";
    uid: "api";
    description: "API health and performance.";
    tags: ["api", "production"];
    refresh: "30s";
    datasource: prometheus("prometheus-main");

    variable "instance" {
        query: promql!("label_values(up{job=\"api\"}, instance)");
        multi: true;
        include_all: true;
    }

    row "Latency" {
        timeseries "Request latency" {
            query: promql!("histogram_quantile(0.99, rate(request_duration_seconds_bucket[$__rate_interval]))") {
                legend_format: "p99";
            }
            unit: seconds;
            width: 12;

            legend {
                position: bottom;
                mode: table;
                values: [last, min, max];
            }
        }
    }
};
# let _ = dashboard;
The DSL supports timeseries, stat, gauge, table, text, bar_gauge,
and heatmap panels at both dashboard and row level. promql! and loki!
create typed query builders rather than opaque JSON values.
Titles, variable names, and link targets are expressions, so dashboards can be generated from data. panel: <expr>; drops in one panel built in Rust and panels: <expr>; drops in any iterator of them. <kind> from <expr> { … } continues a builder from your own house-default function; the base keeps its title, and giving the block a title as well is a compile error:
use panelist::prelude::*;

fn house_stat(title: &str) -> Stat {
    Stat::new(title).graph_mode(StatGraphMode::None).width(4)
}

let services = ["auth", "billing", "search"];
let dashboard = dashboard! {
    title: "Services";

    stat from house_stat("Availability") {
        query: promql!("avg(up)");
        unit: percent_unit;
    }

    row "Per service" {
        panels: services.iter().map(|service| {
            house_stat(&format!("{service} errors")).query(PrometheusQuery::new(format!(
                "sum(rate({service}_errors_total[$__rate_interval]))"
            )))
        });
    }

    row format!("{} latency", services[0]) {
        timeseries format!("{} p99", services[0]) {
            query: promql!(format!("histogram_quantile(0.99, sum by (le) (rate({}_duration_seconds_bucket[$__rate_interval])))", services[0]));
            unit: seconds;
        }
        panel: Text::new("Notes").content("Latency targets live in the runbook.");
    }
};
# let _ = dashboard;
A title runs up to the { that opens its block. Wrap one that contains a block of its own in parentheses: stat (if critical { "Errors!" } else { "Errors" }) { … }.
Thresholds take a mandatory base color, the color below the lowest step, and then ascending steps. Write the base as thresholds(<color>) { … } or as base: <color>; inside the block. A step is <value> => <color>, where the color is a named color, a string naming any other Grafana color, or a Color expression, or <color word>: <value> for a named color:
use panelist::prelude::*;

let warning = 70.0;
let dashboard = dashboard! {
    title: "Saturation";

    gauge "CPU" {
        query: promql!("avg(rate(cpu_seconds_total[$__rate_interval])) * 100");
        unit: percent;
        thresholds {
            base: blue;
            50 => green;
            warning => orange;
            90 => "dark-red";
        }
    }
};
# let _ = dashboard;
mode: percentage; makes the steps percentages of the field's range.
Dashboard links, cursor sync, and the full variable surface are reachable too:
use panelist::prelude::*;

let dashboard = dashboard! {
    title: "API";
    cursor_sync: crosshair;

    link "Runbook" => "https://runbook.internal/api" {
        target_blank: true;
        tags: ["ops"];
    }

    variable "instance" {
        query: promql!("label_values(up, instance)");
        regex: "prod-.*";
        sort: alphabetical_asc;
        all_value: ".*";
        allow_custom_value: true;
        skip_url_sync: true;
        current "Production" => "prod";
    }
};
# let _ = dashboard;
A variable's kind comes from its selector: query:, plugin:, value:, or
values:. plugin: makes a datasource variable, and is distinct from
datasource:, which sets the datasource a query variable runs against:
use panelist::prelude::*;

let dashboard = dashboard! {
    title: "API";

    variable "source" {
        plugin: "prometheus";
        regex: "prod-.*";
        current "Main" => "prometheus-main";
    }

    variable "instance" {
        query: promql!("label_values(up, instance)");
        datasource: prometheus("prometheus-main");
    }
};
# let _ = dashboard;
Setting no selector, or more than one, is a validation error rather than a guess. So is an option the chosen kind has no Grafana key for.
regex and sort have no Grafana key on a custom or constant variable.
Setting them there is a validation error rather than a silent no-op, because
an ignored sort and a working one look identical in the emitted JSON.
Every typed panel option is reachable from the DSL. There is no option that
requires dropping to option "key": json!(…):
use panelist::prelude::*;

let dashboard = dashboard! {
    title: "Options";
    datasource: prometheus("prometheus-main");

    timeseries "Latency" {
        query: promql!("latency");
        fill_opacity: 30.0;
        line_width: 2.0;
        line_interpolation: smooth;
        show_points: never;
        span_nulls: true;

        tooltip {
            mode: multi;
            sort: desc;
        }
    }

    stat "Status" {
        query: promql!("up");
        color_mode: background;
        color: fixed(red);

        mapping "0" => "Down";
        mapping "1" => "Up" { color: green; }

        link "Runbook" => "https://runbook.internal/api" {
            target_blank: true;
        }

        reduce {
            calculations: [mean, max];
            fields: "/.*/";
        }
    }
};
# let _ = dashboard;
color_mode is shared between stat and heatmap panels and takes a different vocabulary on each: value/background/none versus scheme/opacity. A key that takes a word also takes any expression of the builder argument's type, such as unit: Unit::custom("USD");. A lone identifier is read as a word, so wrap a local variable in parentheses: orientation: (orientation);.
Thresholds always name their base color first: it applies below the first step. Field colors, units, and query evaluation are typed too:
use panelist::prelude::*;

let dashboard = dashboard! {
    title: "Checkout";
    datasource: prometheus("prometheus-main");

    stat "Revenue today" {
        query: promql!("sum(increase(checkout_revenue_total[1d]))") {
            query_type: instant;
        }
        unit: currency(Currency::Usd);

        thresholds(red) {
            yellow: 10000.0;
            green: 50000.0;
        }
    }

    timeseries "Requests by instance" {
        query: promql!("sum by (instance) (rate(http_requests_total{job=\"checkout\"}[$__rate_interval]))");
        unit: reqps;
        color: by_name;
    }
};
# let _ = dashboard;
color: by_name keys each series' color on its name, so $instance values keep their colors when instances come and go. The positional classic_palette shifts every later series to a new color whenever one appears or disappears; keep it for a small, fixed set of series. fixed(..), shades(..), thresholds, and continuous(..) with a palette word such as blue_yellow_red cover the other Grafana color modes.
Table panels can transform, sort, and style their columns without leaving the DSL:
use panelist::prelude::*;

let dashboard = dashboard! {
    title: "Routes";
    datasource: prometheus("prometheus-main");

    row "Routes" {
        table "Route performance" {
            query: promql!("sum by (route) (rate(http_requests_total[$__rate_interval]))") {
                ref_id: "A";
                format: table;
                query_type: instant;
            }
            width: 24;

            transform organize {
                rename "Value #A" => "RPS";
                order ["route", "RPS"];
            }
            sort_by: ("RPS", desc);

            override field("RPS") {
                unit: reqps;
                cell: colored_background;
            }
        }
    }
};
# let _ = dashboard;
Table configuration stays typed throughout:
- Transformations:
join_by_field,sort_by,rename_by_regex,organize,time_series_to_table, andlabels_to_fields. Scope any of them to one query withonly ref_id(..)oronly frame_name(..), or.only_ref_id(..)on the builder. - Field matchers:
field(name),regex(pattern),type(field_type),query(ref_id),names([..]),numeric, andtime. - Cell renderers:
auto,colored_text,colored_background,gauge, andsparkline. Renderers with their own options also have block forms.
Set a default renderer with cell: <type>; on the table, or set one inside an
override for selected fields. For transformations Panelist does not model,
transform: <expr>; accepts a RawTransformation or Transformation value.
The most common multi-query table, one row per label value and one column per query, has its own panel kind. keyed_table <title> by <label> takes every table key, plus key_name, column <name> => <query>, and trend <reducer> <name> => <query>, and each column names its header once:
use panelist::prelude::*;

let dashboard = dashboard! {
    title: "Routes";
    datasource: prometheus("prometheus-main");

    row "Routes" {
        keyed_table "Route performance" by "route" {
            width: 24;
            sort_by: ("p95", desc);
            key_name: "Route";

            column "RPS" => promql!("sum by (route) (rate(http_requests_total[$__rate_interval]))") {
                unit: reqps;
            }
            column "p95" => promql!("histogram_quantile(0.95, sum by (route, le) (rate(http_request_duration_seconds_bucket[$__rate_interval])))") {
                unit: seconds;
                cell: colored_background;
                thresholds(green) {
                    yellow: 0.3;
                    red: 1.0;
                }
            }
            trend last "Trend" => promql!("sum by (route) (rate(http_requests_total[$__rate_interval]))") {
                cell: sparkline { hide_value: true; };
            }
        }
    }
};
dashboard.validate()?;
# Ok::<(), panelist::Error>(())
The builder form is the same thing. keyed turns a configured table into a KeyedTable:
use panelist::prelude::*;

let routes = Table::new("Route performance")
    .width(24)
    .sort_by("p95", SortDirection::Descending)
    .keyed("route")
    .key_name("Route")
    .column(
        Column::new("RPS", promql!("sum by (route) (rate(http_requests_total[$__rate_interval]))"))
            .unit(Unit::RequestsPerSecond),
    )
    .column(
        Column::new("p95", promql!("histogram_quantile(0.95, sum by (route, le) (rate(http_request_duration_seconds_bucket[$__rate_interval])))"))
            .unit(Unit::Seconds)
            .cell(TableCellType::ColoredBackground)
            .thresholds(Thresholds::absolute(Color::Green).step(0.3, Color::Yellow).step(1.0, Color::Red)),
    )
    .column(
        Column::trend("Trend", promql!("sum by (route) (rate(http_requests_total[$__rate_interval]))"), Reducer::Last)
            .cell(SparklineCell::new().hide_value(true)),
    );

let dashboard = Dashboard::new("Routes")
    .datasource(prometheus("prometheus-main"))
    .row(Row::new("Routes").panel(routes));
# let _ = dashboard;
It lowers into the ordinary table you would otherwise write by hand: instant format: table queries for value columns and a range query for each trend, reference IDs, a time-series-to-table step for the trends, an outer join on the key, an organize step that renames Grafana's Value #<refId> and Trend #<refId> fields to the column names and orders them, and one override per column. Anything set on the table before keyed comes after the lowering, so extra overrides win and extra transformations see the column names. The join is Grafana's plain outer join: the tabular outer join expands into one row per key per query on Grafana 11.5. A key is one label, because Grafana joins on one field; build a combined label with PromQL's label_join to key on several.
Heatmap panels configure their color scale and Y axis directly:
use panelist::prelude::*;

let dashboard = dashboard! {
    title: "Latency";
    datasource: prometheus("prometheus-main");

    row "Latency" {
        heatmap "Latency distribution" {
            query: promql!("sum by (le) (rate(request_duration_seconds_bucket[$__rate_interval]))") {
                format: heatmap;
            }
            unit: seconds;
            width: 12;
            color_scheme: "Oranges";
            color_steps: 64;
            cell_gap: 1;
            calculate: false;

            y_axis {
                unit: seconds;
                placement: left;
            }
        }
    }
};
# let _ = dashboard;
Repeats, time overrides, value mappings, data links, and annotations are one line each:
use panelist::prelude::*;

let dashboard = dashboard! {
    title: "API";
    datasource: prometheus("prometheus-main");

    variable "instance" {
        query: promql!("label_values(up{job=\"api\"}, instance)");
        multi: true;
    }

    annotation "Restarts" => "changes(process_start_time_seconds{job=\"api\"}[2m]) > 0" {
        text_format: "{{instance}} restarted";
        icon_color: orange;
    }

    stat "Up on $instance" {
        query: promql!("up{instance=\"$instance\"}");
        repeat: horizontal("instance", 4);
        time_from: "1h";
        min_interval: "30s";

        mapping "1" => "Up" { color: green; }
        mapping range(0.0, 0.5) => "Degraded" { color: yellow; }
        mapping special(null) => "No data";

        link "Runbook" => "https://runbook.example/api";
        data_link "Logs" => "/explore?instance=${__field.labels.instance}" {
            keep_time: true;
        }
    }
};
# let _ = dashboard;
Grafana expands a repeat when the dashboard loads, so Panelist lays out the authored panel once. A horizontal repeat always spans the full row, because Grafana stretches it to 24 columns and splits that row between the clones, max_per_row at a time (4 by default). A vertical repeat keeps the panel's width. Row::repeat repeats a whole row. Repeating by a variable the dashboard does not declare is a validation error.
Value mappings come in Grafana's four kinds: exact value, numeric range, regex, and special (null, NaN, null or NaN, true, false, empty). Panelist emits them the way Grafana's mapping editor saves them, so exact values take precedence over the other kinds. link adds a link to the panel header and data_link adds one to the field values; both are Grafana data links, and DataLinkVariable spells the built-in ${__value.raw}-style variables. annotation adds a typed Prometheus annotation query, and RawAnnotation covers other datasources.
Mistakes are compile errors at the token that caused them. A typo names the closest valid key and lists every key the block accepts. A key that does not apply to the panel kind says which kinds it applies to:
error: `fill_opacity` does not apply to a `stat` panel; it applies to `timeseries` panels
  --> src/dashboards.rs:12:13
   |
12 |             fill_opacity: 10.0;
   |             ^^^^^^^^^^^^
The dashboard! reference lists every key.
Every important DSL construct has a normal Rust equivalent for IDE discovery, dynamic generation, and users who prefer builders:
use panelist::prelude::*;

let panel = Timeseries::new("Requests")
    .query(
        PrometheusQuery::new("rate(http_requests_total[$__rate_interval])")
            .legend_format("{{status}}"),
    )
    .unit(Unit::RequestsPerSecond)
    .width(12);

let dashboard = Dashboard::new("HTTP")
    .datasource(prometheus("prometheus-main"))
    .row(Row::new("Traffic").panel(panel));
# let _ = dashboard;
A query can carry its own field properties, so styling one query's series needs no hand-picked reference ID. Panelist emits them as a field override on the reference ID the query resolves to, ahead of the panel's own overrides, so a panel-level override can still refine one series:
use panelist::prelude::*;

let panel = Timeseries::new("Requests and errors")
    .query(
        PrometheusQuery::new("sum(rate(http_requests_total[$__rate_interval]))")
            .legend_format("requests")
            .color(Color::Green),
    )
    .query(
        PrometheusQuery::new("sum(rate(http_requests_total{status=~\"5..\"}[$__rate_interval]))")
            .legend_format("errors")
            .color(Color::Red),
    )
    .unit(Unit::RequestsPerSecond)
    .thresholds(Thresholds::absolute(Color::Green).step(100.0, Color::Red));
# let _ = panel;
One panel can query several datasources through Grafana's mixed datasource. Each query then names its own, and validation reports one that does not:
use panelist::prelude::*;

let panel = Timeseries::new("Requests and error logs")
    .datasource(DataSource::mixed())
    .query(
        PrometheusQuery::new("sum(rate(http_requests_total[$__rate_interval]))")
            .datasource(prometheus("prometheus-main")),
    )
    .query(
        LokiQuery::new("sum(count_over_time({job=\"api\"} |= \"error\" [$__interval]))")
            .datasource(loki("loki-main")),
    );
# let _ = panel;
In the DSL, datasource: mixed; does the same on a panel.
The typed API covers:
- dashboards, rows, datasources, time ranges, links, and persisted variable state;
- Prometheus and Loki queries, including range, instant, and combined evaluations, time-series, table, and heatmap result formats, per-query field properties, and the mixed datasource;
- datasource, query, custom, and constant variables;
- field defaults, units including every Grafana currency, value, range, regex, and special value mappings, field data links, thresholds, color schemes, legends, overrides, and field matchers;
- panel repeats, row repeats, query options, and relative time overrides;
- Prometheus annotation queries and Grafana's built-in annotation entry;
- transformations, keyed multi-query tables, table cells and sorting, heatmaps, and the common options for stat, time-series, gauge, and bar-gauge panels.
When Grafana supports something Panelist does not model yet, use RawQuery,
RawPanel, RawTransformation, or the ordered extra, option, and custom
methods.
A RawQuery emits only the keys you set. RawQuery::new().expression(..) writes expr for Prometheus-compatible datasources, and a datasource without expressions, such as CloudWatch, takes its whole query from .extra(..):
use panelist::prelude::*;
use serde_json::json;

let query = RawQuery::new()
    .datasource(DataSource::new("cloudwatch", "cloudwatch-main"))
    .extra("namespace", json!("AWS/EC2"))
    .extra("metricName", json!("CPUUtilization"));
# let _ = query;
Real-world provisioning metadata and visualization choices remain typed:
use panelist::prelude::*;

let dashboard = Dashboard::new("Operations")
    .target(GrafanaTarget::V11_5)
    .version(1)
    .cursor_sync(DashboardCursorSync::Crosshair)
    .variable(
        DataSourceVariable::new("datasource", "prometheus")
            .current(VariableSelection::new("staging", "prometheus-staging")),
    )
    .panel(
        Timeseries::new("Requests")
            .query(
                PrometheusQuery::new("sum(rate(requests_total[5m]))")
                    .editor_mode(QueryEditorMode::Code),
            )
            .fill_opacity(10.0)
            .show_points(PointVisibility::Never)
            .tooltip(Tooltip::new().mode(TooltipMode::Multi)),
    );
# let _ = dashboard;Grafana dashboards use 24 columns. Panelist places panels from left to right,
wraps before a panel would exceed column 24, and advances following rows below
the tallest panel on each line. Defaults are visualization-specific; use
.width(), .height(), or width:/height: in the DSL to adjust them.
An explicit GridPos remains available for unusual layouts:
# use panelist::prelude::*;
let panel = Timeseries::new("Pinned")
    .grid_pos(GridPos::new(6, 10, 12, 8));
# let _ = panel;
Expanded rows serialize their panels at the dashboard level, as Grafana Classic expects. Collapsed rows retain their panels inside the row object and only consume the one-unit row header while collapsed.
By default, panels and rows are numbered 1, 2, 3, … in dashboard order, skipping any ID pinned with .id(N). These positional IDs are small and readable, but inserting or reordering a panel renumbers everything after it. That breaks viewPanel= and editPanel= links and embeds, and makes every later panel show up in the JSON diff.
PanelIds::Stable derives each ID from the panel's identity instead, so it survives insertion, removal, reordering, and collapsing a row:
use panelist::prelude::*;

let dashboard = Dashboard::new("Checkout")
    .panel_ids(PanelIds::Stable)
    .row(
        Row::new("HTTP")
            .key("http")
            .panel(Timeseries::new("Requests"))
            .panel(Stat::new("Errors").key("errors")),
    );
# let _ = dashboard;
An unkeyed panel's identity is its row's identity plus its own title, and a row's identity is its title. So renaming an unkeyed panel, or the row it sits in, changes its ID. A .key("…") replaces the titles: a keyed row keeps its ID, and its unkeyed panels keep theirs, across a rename, and a keyed panel keeps its ID across a rename and a move to another row. Use keys where titles repeat or where links must outlive a rename.
In dashboard!, the same dashboard is panel_ids: stable; with a key: "…"; in the row or panel block:
use panelist::prelude::*;

let dashboard = dashboard! {
    title: "Checkout";
    panel_ids: stable;

    row "HTTP" {
        key: "http";
        timeseries "Requests" {}
        stat "Errors" { key: "errors"; }
    }
};
# let _ = dashboard;
The hash is a fixed, documented FNV-1a, so IDs never change between Rust or Panelist releases, and they fall in 65536..2^30, inside Grafana's uint32 panel IDs and clear of small hand-pinned IDs. Two panels or rows that land on the same ID, including a derived ID equal to an explicit one, are a validation error naming both. Panelist never quietly picks another ID.
Fragments are ordinary Rust values:
use panelist::prelude::*;

fn http_panels(service: &str) -> Vec<Panel> {
    vec![
        Timeseries::new("Requests")
            .query(PrometheusQuery::new(format!(
                "sum(rate({service}_requests_total[$__rate_interval]))"
            )))
            .into(),
        Stat::new("Errors")
            .query(PrometheusQuery::new(format!(
                "sum(rate({service}_errors_total[$__rate_interval]))"
            )))
            .into(),
    ]
}

let panels = http_panels("checkout");
let dashboard = dashboard! {
    title: "Checkout";
    row "HTTP" {
        panels: panels;
    }
};
# let _ = dashboard;Expressions stay plain strings, but two parts of them are painful to splice with format!: label selectors, whose braces must be doubled, and legend formats, where Grafana's {{label}} becomes {{{{label}}}}. Selector and legend! take care of both:
use panelist::prelude::*;

let base = Matchers::new().eq("job", "api").re("instance", "$instance");
let requests = Selector::metric("http_requests_total").with(&base);
let errors = requests.clone().re("status", "5..");

let panel = Timeseries::new("Error ratio by route")
    .query(
        PrometheusQuery::new(format!(
            "sum by (route) (rate({})) / sum by (route) (rate({}))",
            errors.range("$__rate_interval"),
            requests.range("$__rate_interval"),
        ))
        .legend_format(legend!("{route} · errors")),
    );
# let _ = panel;
Selector quotes and escapes label values, keeps matchers in insertion order, and passes Grafana variables through. A range attaches to the selector itself, so a factored-out selector cannot turn rate(metric{…}[5m]) into the stepless subquery rate((metric{…})[5m]). legend! turns {label} into {{label}} and rejects anything that is not a Prometheus label name at compile time; legend() does the same at run time and returns a LegendFormatError.
Dashboard implements serde::Serialize, so normal serde_json APIs work.
The convenience methods add structured errors and file output:
# use panelist::prelude::*;
# let dashboard = Dashboard::new("Example");
dashboard.validate()?;
let compact = dashboard.to_json()?;
let pretty = dashboard.to_json_pretty()?;
dashboard.write_json("dashboard.json")?;
# let _ = (compact, pretty);
# Ok::<(), panelist::Error>(())
Validation reports duplicate explicit panel IDs and query refs, stable panel ID collisions, dashboard UIDs Grafana would refuse, missing titles or expressions, invalid widths and positions, zero heights, and malformed threshold ordering. Invalid authored dashboards return errors instead of panicking.
It also rejects repeats by undeclared variables, malformed minimum intervals and time overrides, value mappings that can never match or change nothing, duplicate exact-value mappings, and annotations without a name or expression.
It also catches query setups Grafana would run differently from how they read: a query on a mixed panel without a datasource of its own, and a Loki query that asks for a combined range-and-instant evaluation Loki cannot run.
Dashboards as code usually means committing the generated JSON, so reviewers see the wire diff and Grafana can provision the files. DashboardSet writes a set of dashboards into a directory and checks that directory in CI:
use std::process::ExitCode;

use panelist::prelude::*;
use panelist::DashboardSet;

fn main() -> ExitCode {
    let dashboards = DashboardSet::new()
        .dashboard(Dashboard::new("Checkout").uid("checkout"))
        .dashboard(Dashboard::new("Payments").uid("payments"));

    let result = if std::env::args().any(|arg| arg == "--check") {
        dashboards.check_dir("dashboards")
    } else {
        dashboards.write_dir("dashboards").map(drop)
    };
    match result {
        Ok(()) => ExitCode::SUCCESS,
        Err(error) => {
            eprintln!("{error}");
            ExitCode::FAILURE
        }
    }
}
Each dashboard becomes <uid>.json: validated, pretty-printed JSON with a trailing newline. A dashboard without a UID, or two dashboards sharing one (ignoring case, for case-insensitive filesystems), is an error. check_dir never writes; it fails with a report listing every stale file, every missing file, and every orphaned .json file that no dashboard renders to anymore. write_dir removes the orphans, rewrites only files whose contents changed, and replaces each file atomically. Other files in the directory are left alone.
Validation also checks that every template variable a dashboard references is declared. Grafana leaves an unresolved reference in place, so a typo like $enviroment reaches the datasource verbatim and the panel just shows no data. Panelist reports it as ValidationError::UnknownVariableReference, naming the dashboard, panel or variable, the field, and the name.
These fields are scanned:
- query expressions and legend formats
- datasource UIDs on the dashboard, panels, queries and query variables, such as
prometheus("$datasource") - dashboard and panel link URLs
- query variable definitions
All of Grafana's syntaxes are recognised: $name, ${name}, ${name:format}, ${name.path}, [[name]] and [[name:format]]. Matching follows Grafana's own pattern, so $env_name is one variable called env_name, not $env followed by _name. Write ${env}_name for the latter.
Grafana's global variables need no declaration: $__rate_interval, $__interval, $__interval_ms, $__range, $__range_s, $__range_ms, $__rate_interval_ms, $__from, $__to, $__timeFilter, $timeFilter, $__timezone, $__dashboard, $__name, $__org, $__user, $__url_time_range, $__all_variables, $__all, $__auto and $__searchFilter. Dotted forms like ${__user.login} resolve through their base name. A misspelt built-in in a Prometheus or Loki query is still an error. A RawQuery targets a plugin Panelist does not know, so it also accepts any name in Grafana's reserved __ namespace, such as the SQL macros $__timeGroup and $__unixEpochFilter, plus InfluxQL's legacy $interval.
Grafana resolves variables in declaration order. A chained query variable may only reference variables declared before it, in its query or its datasource. A query variable that inherits the dashboard datasource needs that datasource's variable declared first too. Breaking the order is a ValidationError::VariableReferencedBeforeDeclaration. Panels resolve after every variable, so order does not matter to them.
Some $ signs are not references and never trip the check. Variable regex options are not scanned, so anchors like /^(prod|staging)$/ are fine. Capture references like $1 and ${1} in label_replace are ignored, because no variable can have an all-digit name. A $ followed by no name, as in "^api$", starts no reference.
Validation catches what Panelist knows is wrong. Your own rules, like "every stat states its thresholds" or "every query against a slow job sets its interval", belong in your tests. Dashboard::resolve gives those tests a typed, read-only view, so they never parse the JSON back:
use panelist::prelude::*;

fn check(dashboard: &Dashboard) -> panelist::Result<()> {
    for panel in dashboard.resolve()?.panels() {
        if matches!(panel.kind(), PanelKind::Stat) {
            assert!(
                panel.field_config().thresholds().is_some(),
                "stat {:?} inherits Grafana's default thresholds",
                panel.title()
            );
        }
        for query in panel.queries() {
            if query.expression().is_some_and(|expr| expr.contains("job=\"batch-exporter\"")) {
                assert_eq!(query.interval(), Some("1m"), "query {} in {:?}", query.ref_id(), panel.title());
            }
        }
    }
    Ok(())
}
# check(&Dashboard::new("Example"))?;
# Ok::<(), panelist::Error>(())
The view comes from the same pass that serialization runs, so it shows exactly what Grafana receives. Panel IDs, query reference IDs, and grid positions are filled in. Each panel and query reports the datasource it actually inherits. panels() also visits panels inside collapsed rows, which a walk over the JSON's top-level panels array silently skips. Units, colors, thresholds, and override matchers stay typed values, not strings to compare.
Panelist emits Grafana Classic dashboard JSON. Classic remains importable and exportable in Grafana 13, works with file provisioning, and retains the numeric panel IDs and gridPos behavior that Panelist automates. Grafana's newer V2 resource model uses a different layout representation.
A GrafanaTarget names the Grafana release line the JSON is written for. It sets schemaVersion to the version that release considers current, so Grafana runs no migration over the dashboard on load and its export matches the committed file:
| Target | Verified against | schemaVersion |
|---|---|---|
GrafanaTarget::V11_5 |
Grafana 11.5.2 | 40 |
GrafanaTarget::V13 (default) |
Grafana 13.0.2 | 42 |
# use panelist::prelude::*;
let dashboard = Dashboard::new("Checkout").target(GrafanaTarget::V11_5);
# let _ = dashboard;
In dashboard!, write target: v11_5; or target: v13;.
make verify-grafana round-trips every golden dashboard, rendered for each target, through that target's Grafana release and fails if Grafana drops or alters any property. For another release, pick the nearest older target and override the number with .schema_version(N); that changes only the number.
The authoring model, layout/normalization pass, and Grafana serialization model are separate modules so a future V2 serializer can preserve the DSL and builders. See the schema strategy for scope and references.
Six runnable examples live in crates/panelist/examples,
and each one prints its dashboard JSON:
cargo run -p panelist --example basicbasic.rs— smallest useful dashboardprometheus.rs— multiple targets, thresholds, overrides, and legend calculationsvariables.rs— query and custom variableslayout.rs— automatic wrapping and a reusable Rust fragmentfull_dashboard.rs— realistic GeoIP dashboard using Prometheus and Lokiroute_performance.rs— operational dashboard exercising a keyed multi-query table, typed table cells and sorting, Prometheus result formats, and heatmap options, with zero escape hatches
The gallery shows what each one looks like once Grafana
has rendered it. make demo boots Prometheus, Loki, and Grafana in Docker,
provisions all six from the examples themselves, and serves them on
http://localhost:3000; make render-examples regenerates the gallery
screenshots from that stack, so an image cannot drift from its example.
- Wire
scripts/verify-grafana.sh(make verify-grafana) into CI so every change is validated against a live Grafana for every target automatically. The check already round-trips every golden through Grafana 11.5.2 and 13.0.2 cleanly; it just isn't triggered on every push yet. - Add targets for the Grafana releases in between (11.6 through 12.1 use
schemaVersion41) once each has a verified golden round trip. - Add an opt-in Grafana V2 resource serializer and dynamic layouts.
- Add more transformation types beyond the six modeled today (join, sort, organize, time-series-to-table, labels-to-fields, rename-by-regex).
- Add more datasource query types without turning the core crate into an API client.
- Stabilize the API from real-world dashboard authoring feedback.
The repository is a Rust 2024 virtual workspace. Run make ci before sending a
change; it checks formatting, Clippy, builds, tests, rustdoc, source headers,
packaging, dependency licenses, and security advisories. See
CONTRIBUTING.md for the full workflow.
Panelist is licensed under Apache-2.0.