[BUG] Plot artifact in baseline test images #167
Description
Describe the bug
This was found while making test images for PR #161
The baseline test image for pull plots that was introduced in PR #149 has an axis artifact that is viewable in the pull plot on the sides (it additionally suffers from axis problems from being plotted on subplots).

Steps to reproduce
$ pip list | grep hist
boost-histogram               1.0.0
hist                          2.2.1
histoprint                    2.0.0
The following example is trying to replicate most of
Lines 604 to 625 in e12f748
# example.py
import matplotlib.pyplot as plt
import numpy as np
from hist import Hist, axis
def pdf(x, a=1 / np.sqrt(2 * np.pi), x0=0, sigma=1, offset=0):
return a * np.exp(-((x - x0) ** 2) / (2 * sigma ** 2)) + offset
if __name__ == "__main__":
np.random.seed(42)
hist_1 = Hist(
axis.Regular(
50, -4, 4, name="S", label="s [units]", underflow=False, overflow=False
)
).fill(np.random.normal(size=1000))
hist_2 = Hist(
axis.Regular(
50, -5, 5, name="S", label="s [units]", underflow=False, overflow=False
)
).fill(np.random.normal(size=10000))
fig = plt.figure(figsize=(10, 8))
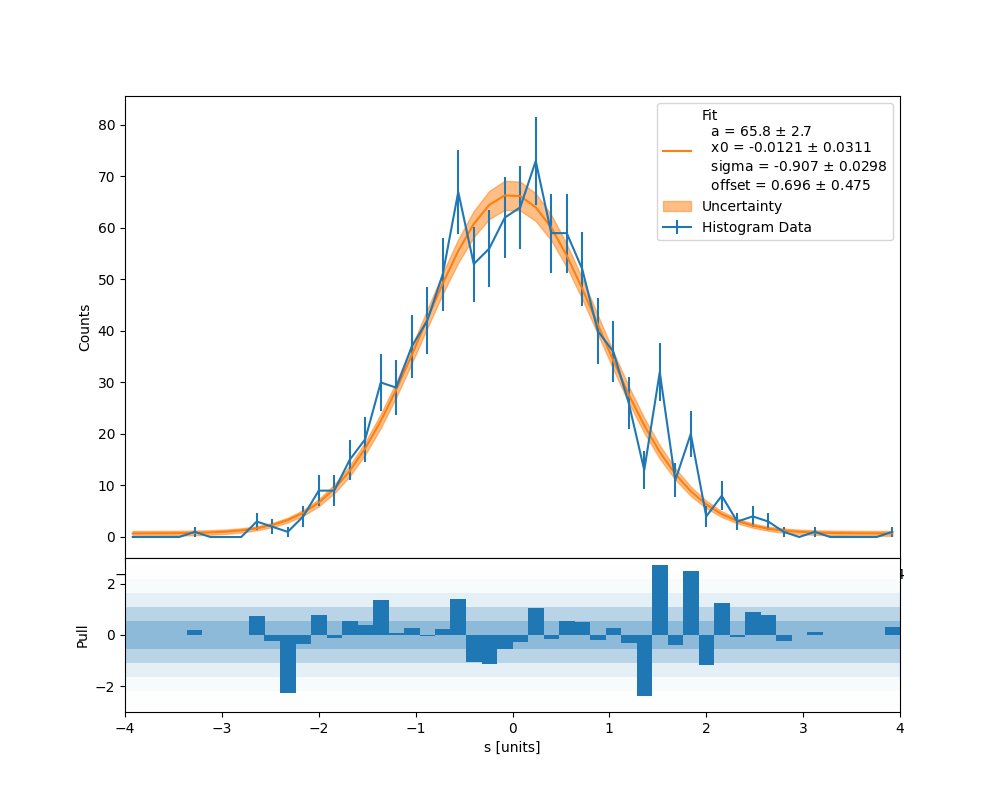
main_ax, pull_ax = hist_1.plot_pull(pdf)
fig.savefig("debug_hist_1.png")
fig = plt.figure(figsize=(10, 8))
main_ax, pull_ax = hist_2.plot_pull(pdf)
fig.savefig("debug_hist_2.png")debug_hist_1.png |
debug_hist_2.png |
|---|---|
 |
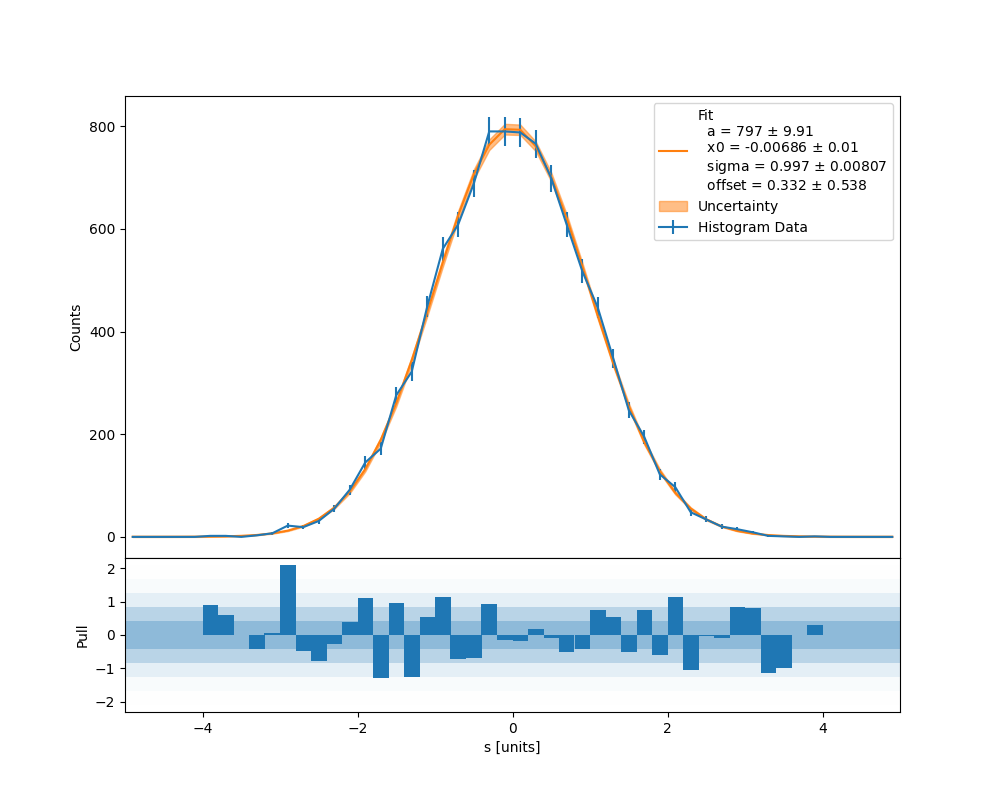 |
It can be seen that debug_hist_2.png (range: [-5, 5]) doesn't exhibit the behavior though debug_hist_1.png (range: [-4, 4]) does, and if you run with a range of [-6, 6] it will exhibit the behavior as well.
From the reproduced bug below I think this is due to the axis from the main axis being drawn over but the edges of it sticking out. I'm not sure though, and would defer to someone more expert in matplotlib. If you look at the artifact closely it appears to be the right hand side of the range limits (in this case 4 — it is easier to see with a range of 6).